Case study · BioGas Deck
BioGas Deck
A long-form investor presentation for a biogas finance professional in Italy, turning subsidy rules, loan structures and market data into clear diagrams.
01 — Context
Biogas investor presentation design for European markets
Our client is a biogas and investment professional based in Italy, working on how renewable energy plants get funded. The research was already there: subsidy schemes, loan structures, bank programmes and market data for Germany and Italy. What he needed was a way to put it in front of potential investors without losing them on slide three. That is what good biogas investor presentation design has to solve: making a complex market easy to judge.
The brief was a long-form summary deck, titled Financing for BioGas Projects Summary, that runs to at least 37 slides. We approached it as presentation design in the fullest sense: shaping the argument, building a visual system, then designing every slide inside that system as an editable PowerPoint file.
The audience matters here. Investors in finance are used to dense documents, but they are reading quickly and deciding whether a market is worth a second meeting. Every slide had to make one point and make it fast.
02 — Structure
Building the argument from preconditions to markets
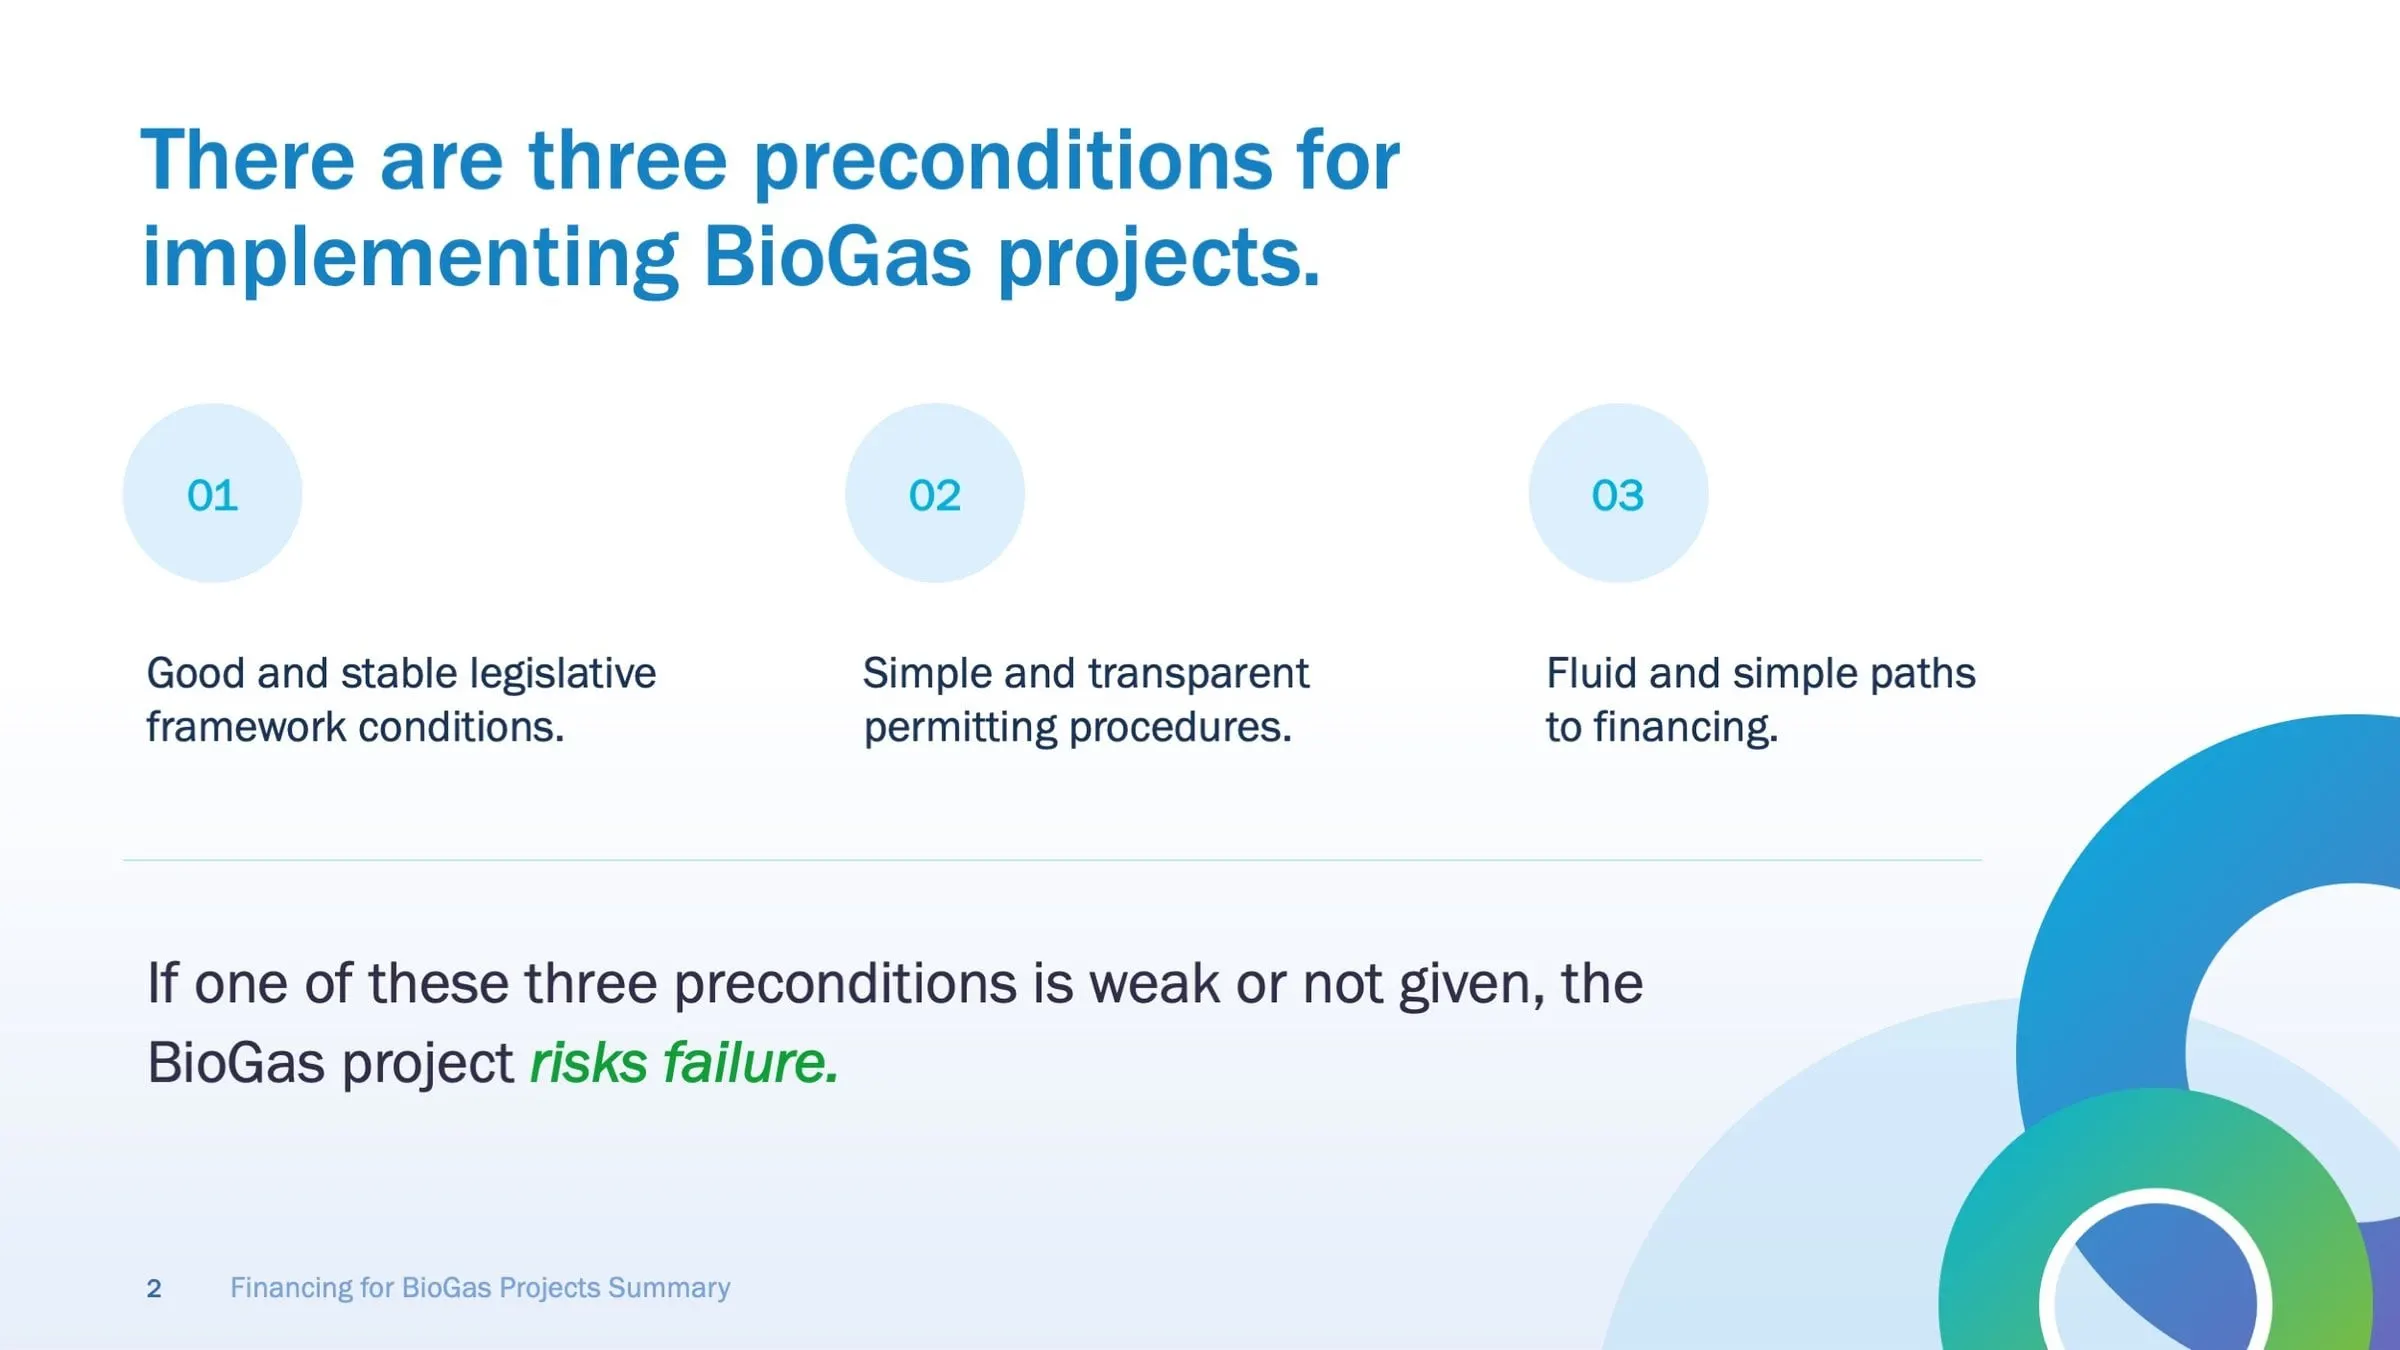
The content leads with a simple frame: a biogas project needs a stable legislative framework, simple and transparent permitting, and a clear path to financing. If one is weak, the project risks failure. We gave that idea its own slide, with three numbered circles and the consequence set larger underneath, so the rest of the deck has something to hang on.
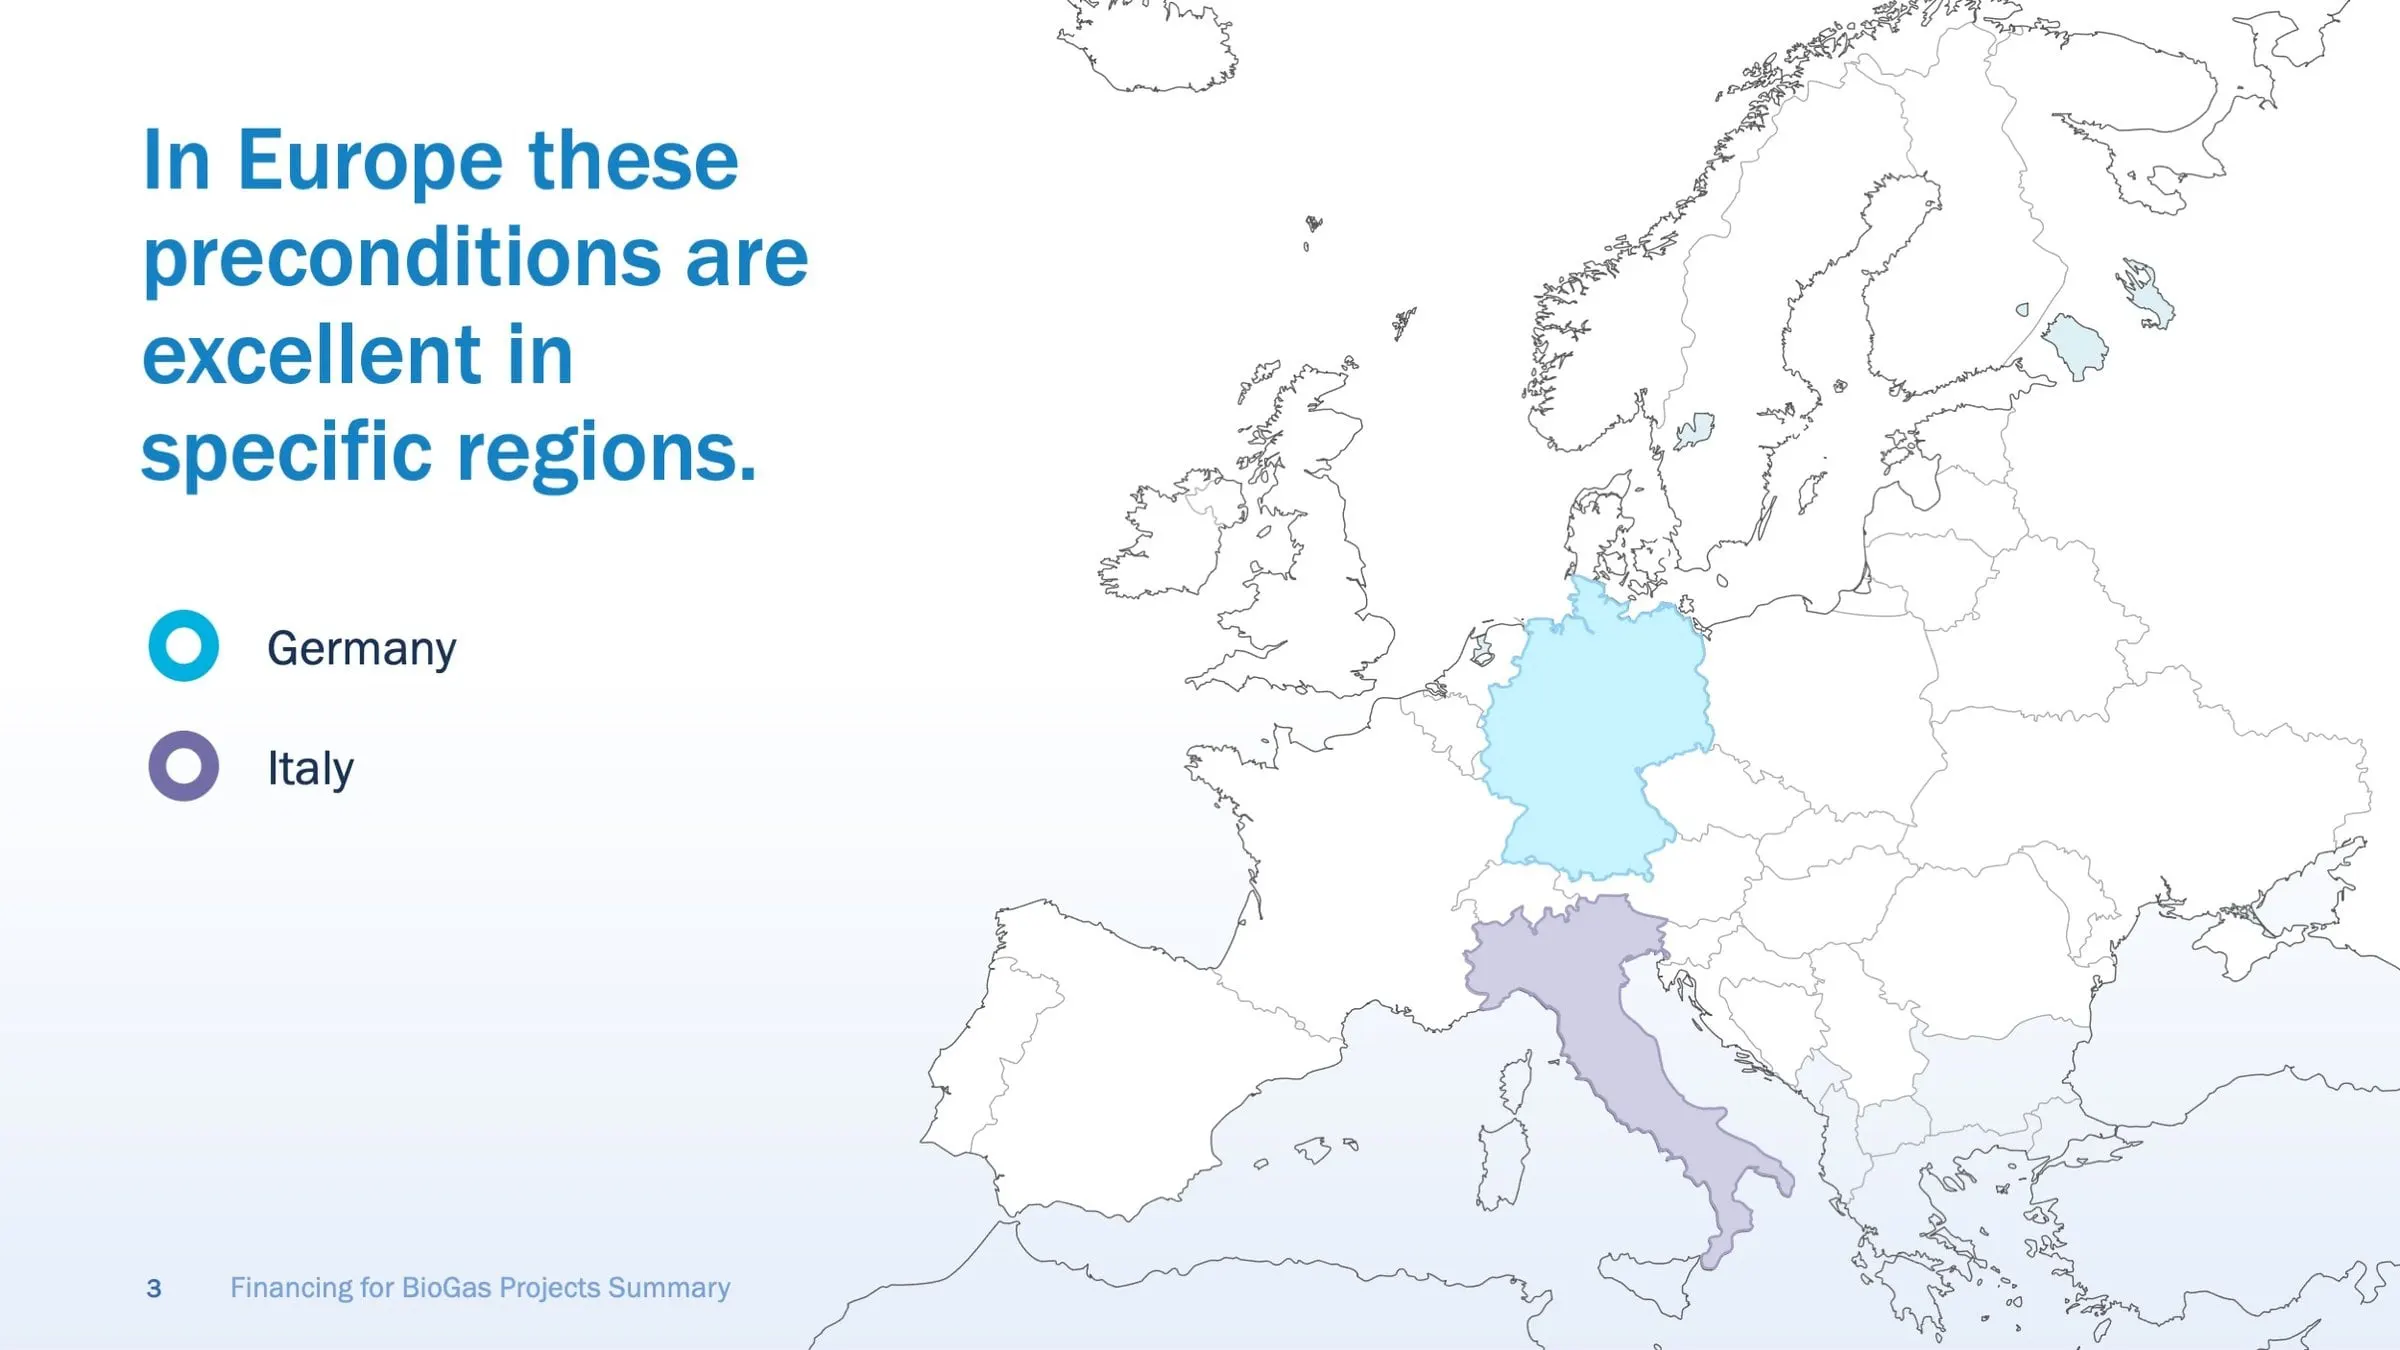
From there the story narrows. A map of Europe shows where those conditions are strongest, picking out Germany in cyan and Italy in purple, and the deck then spends its middle sections on those two markets.
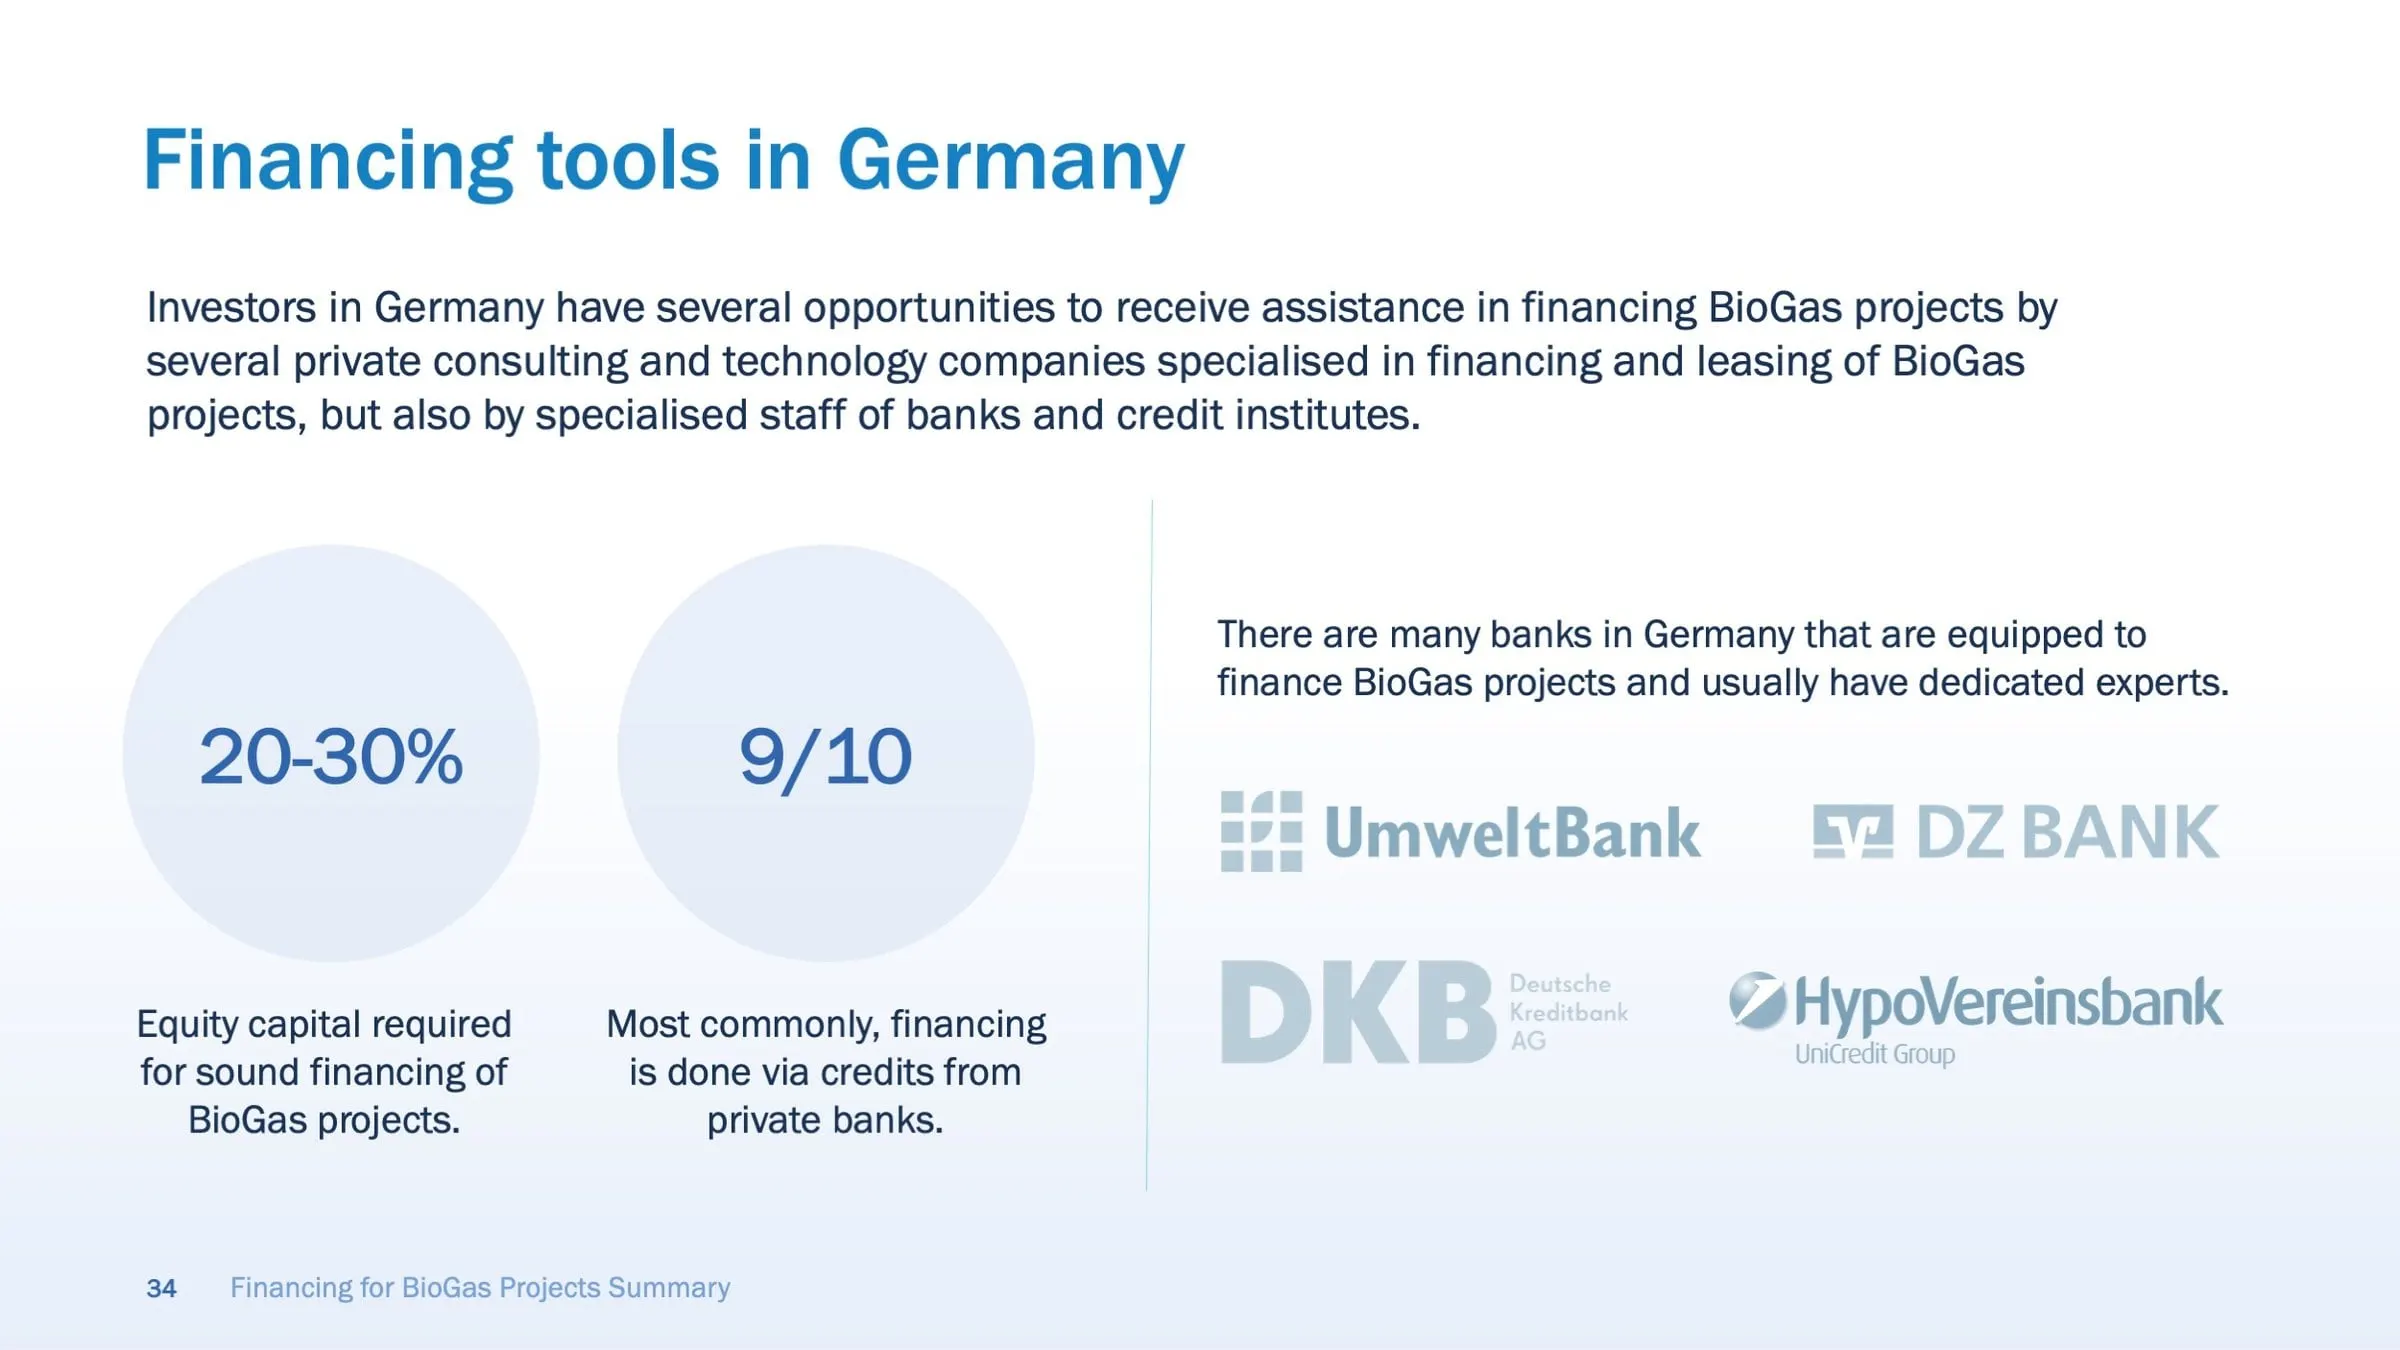
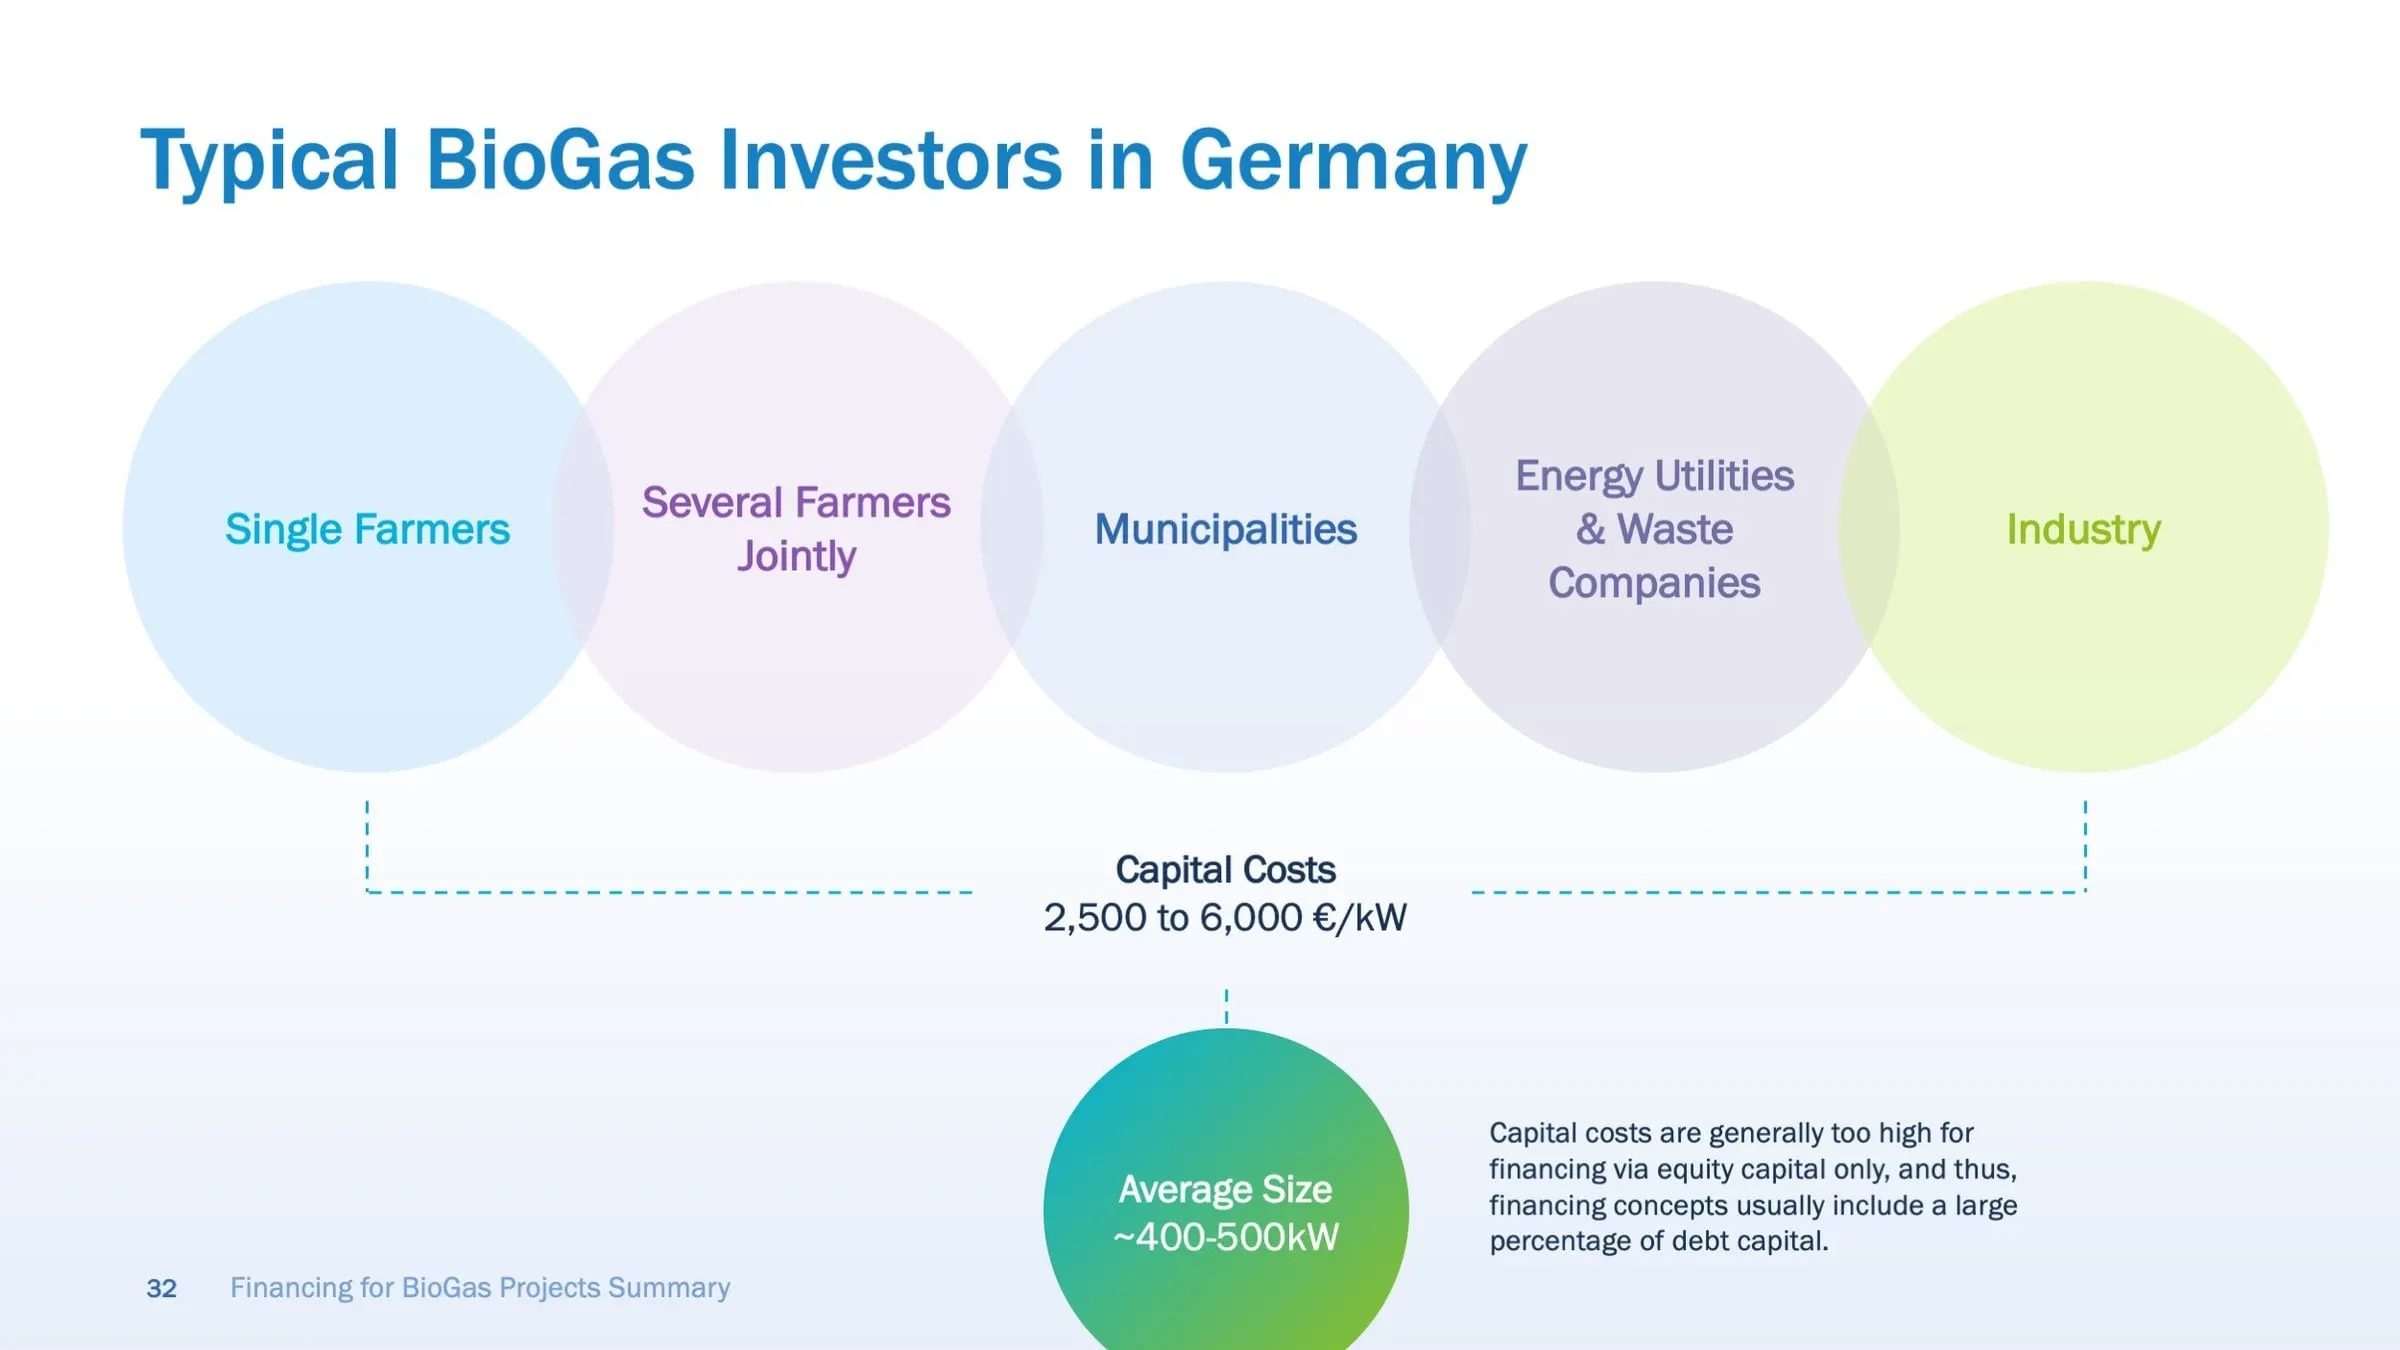
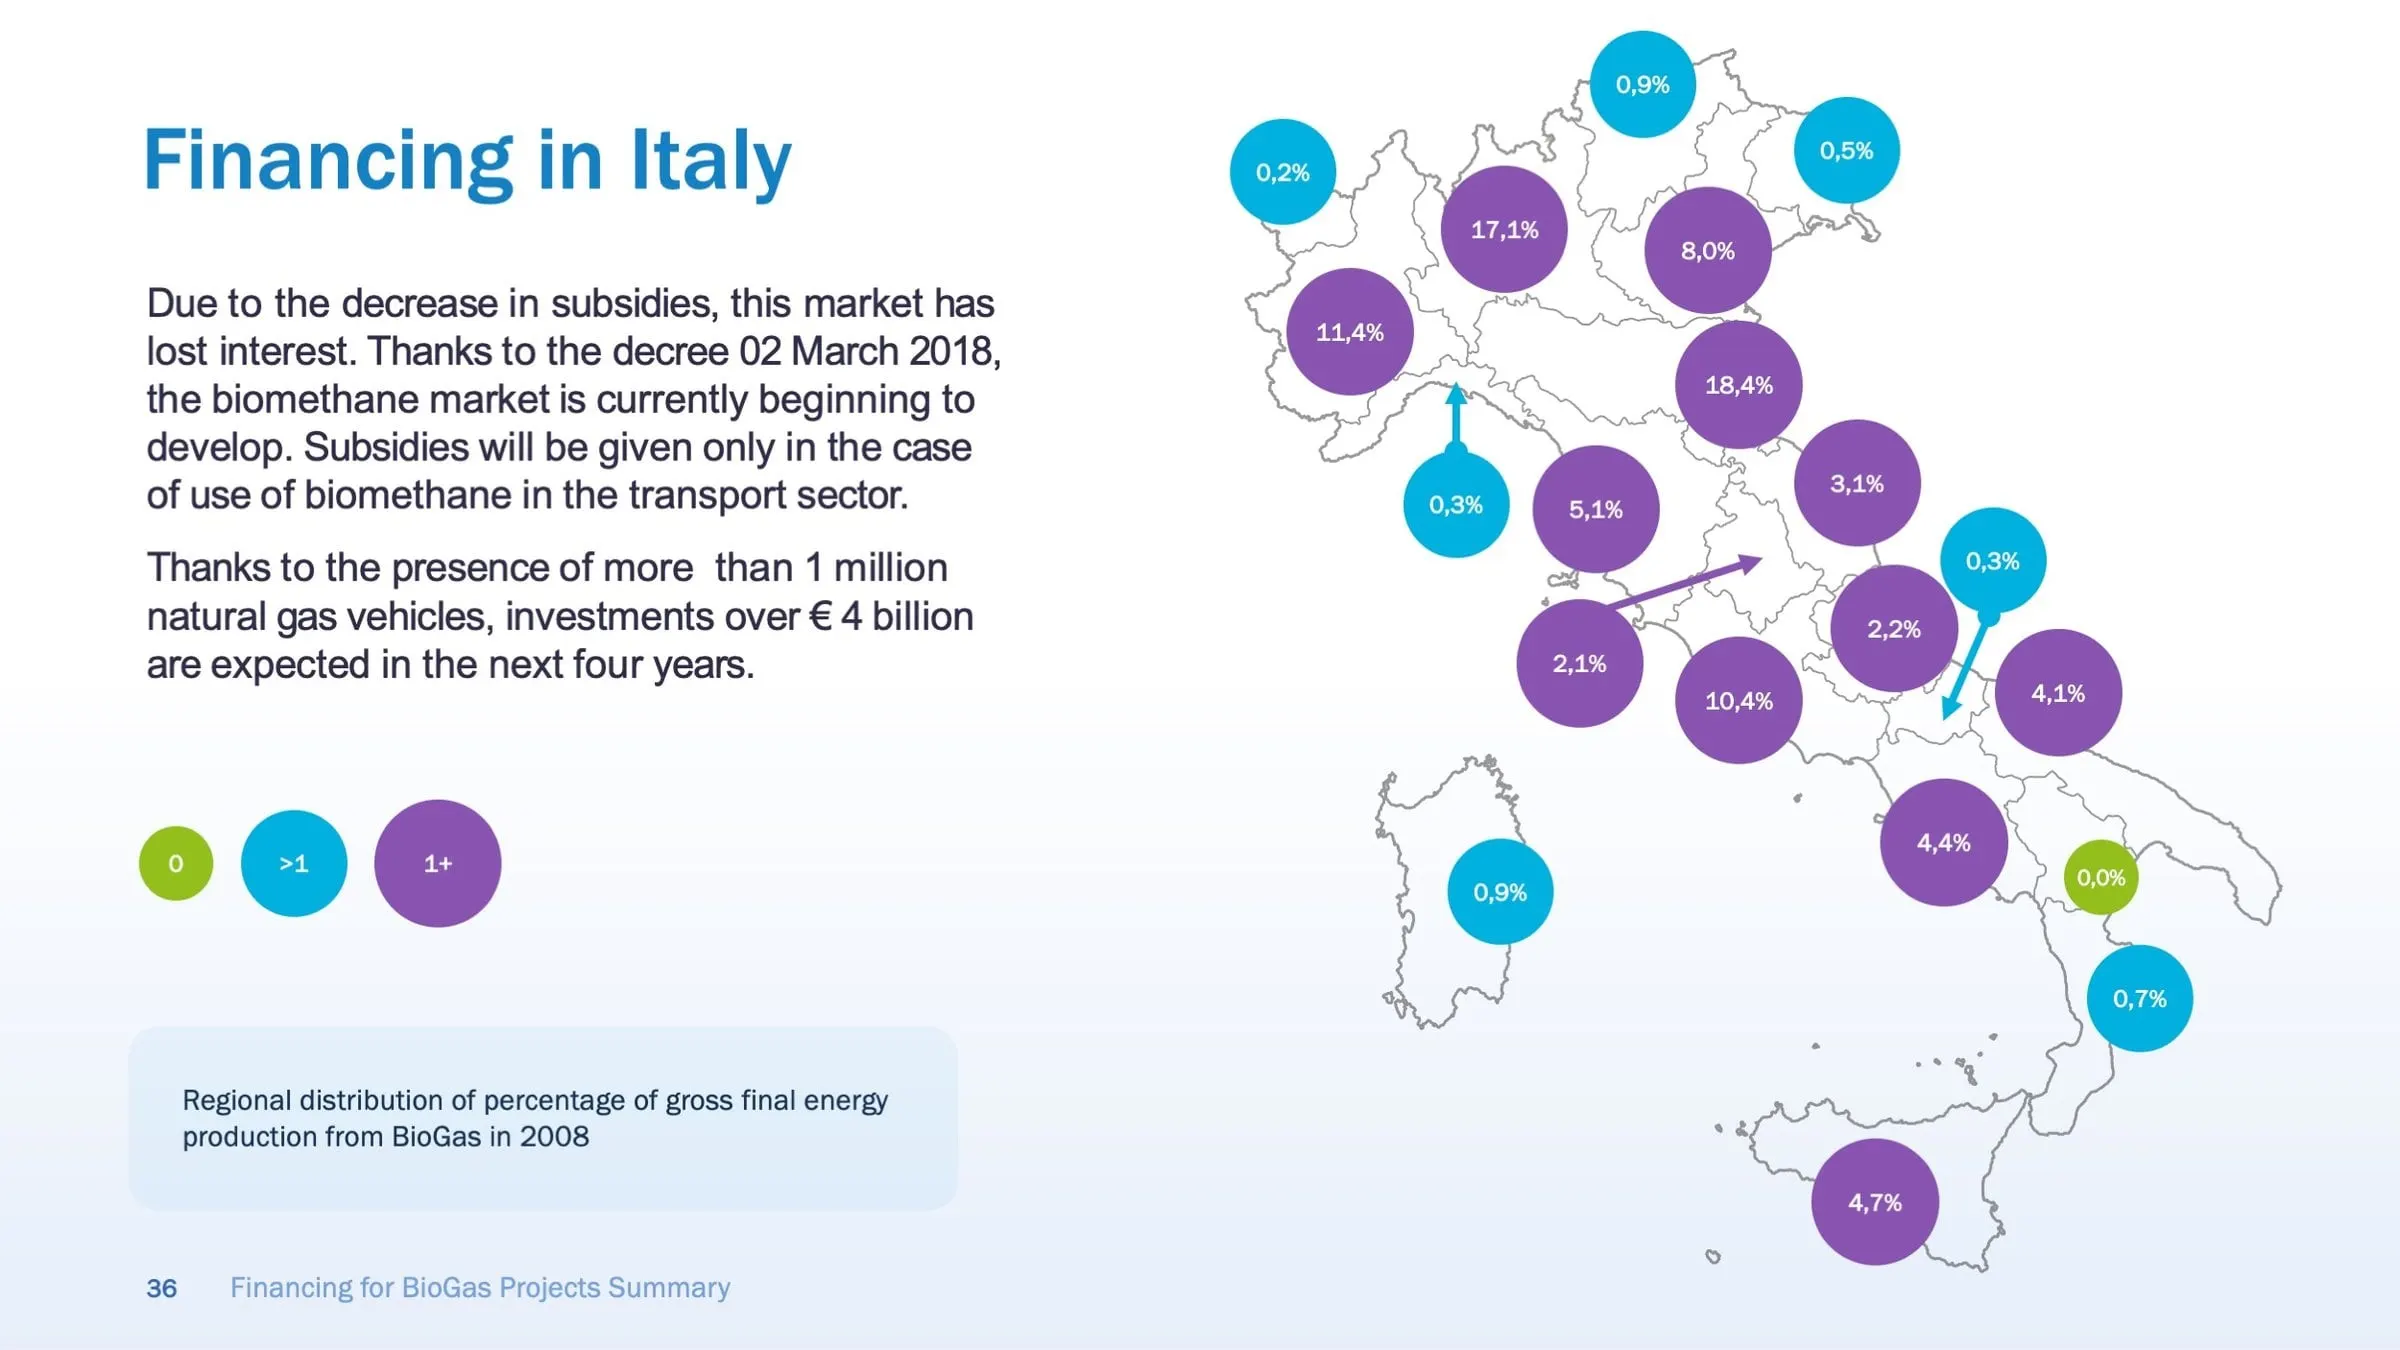
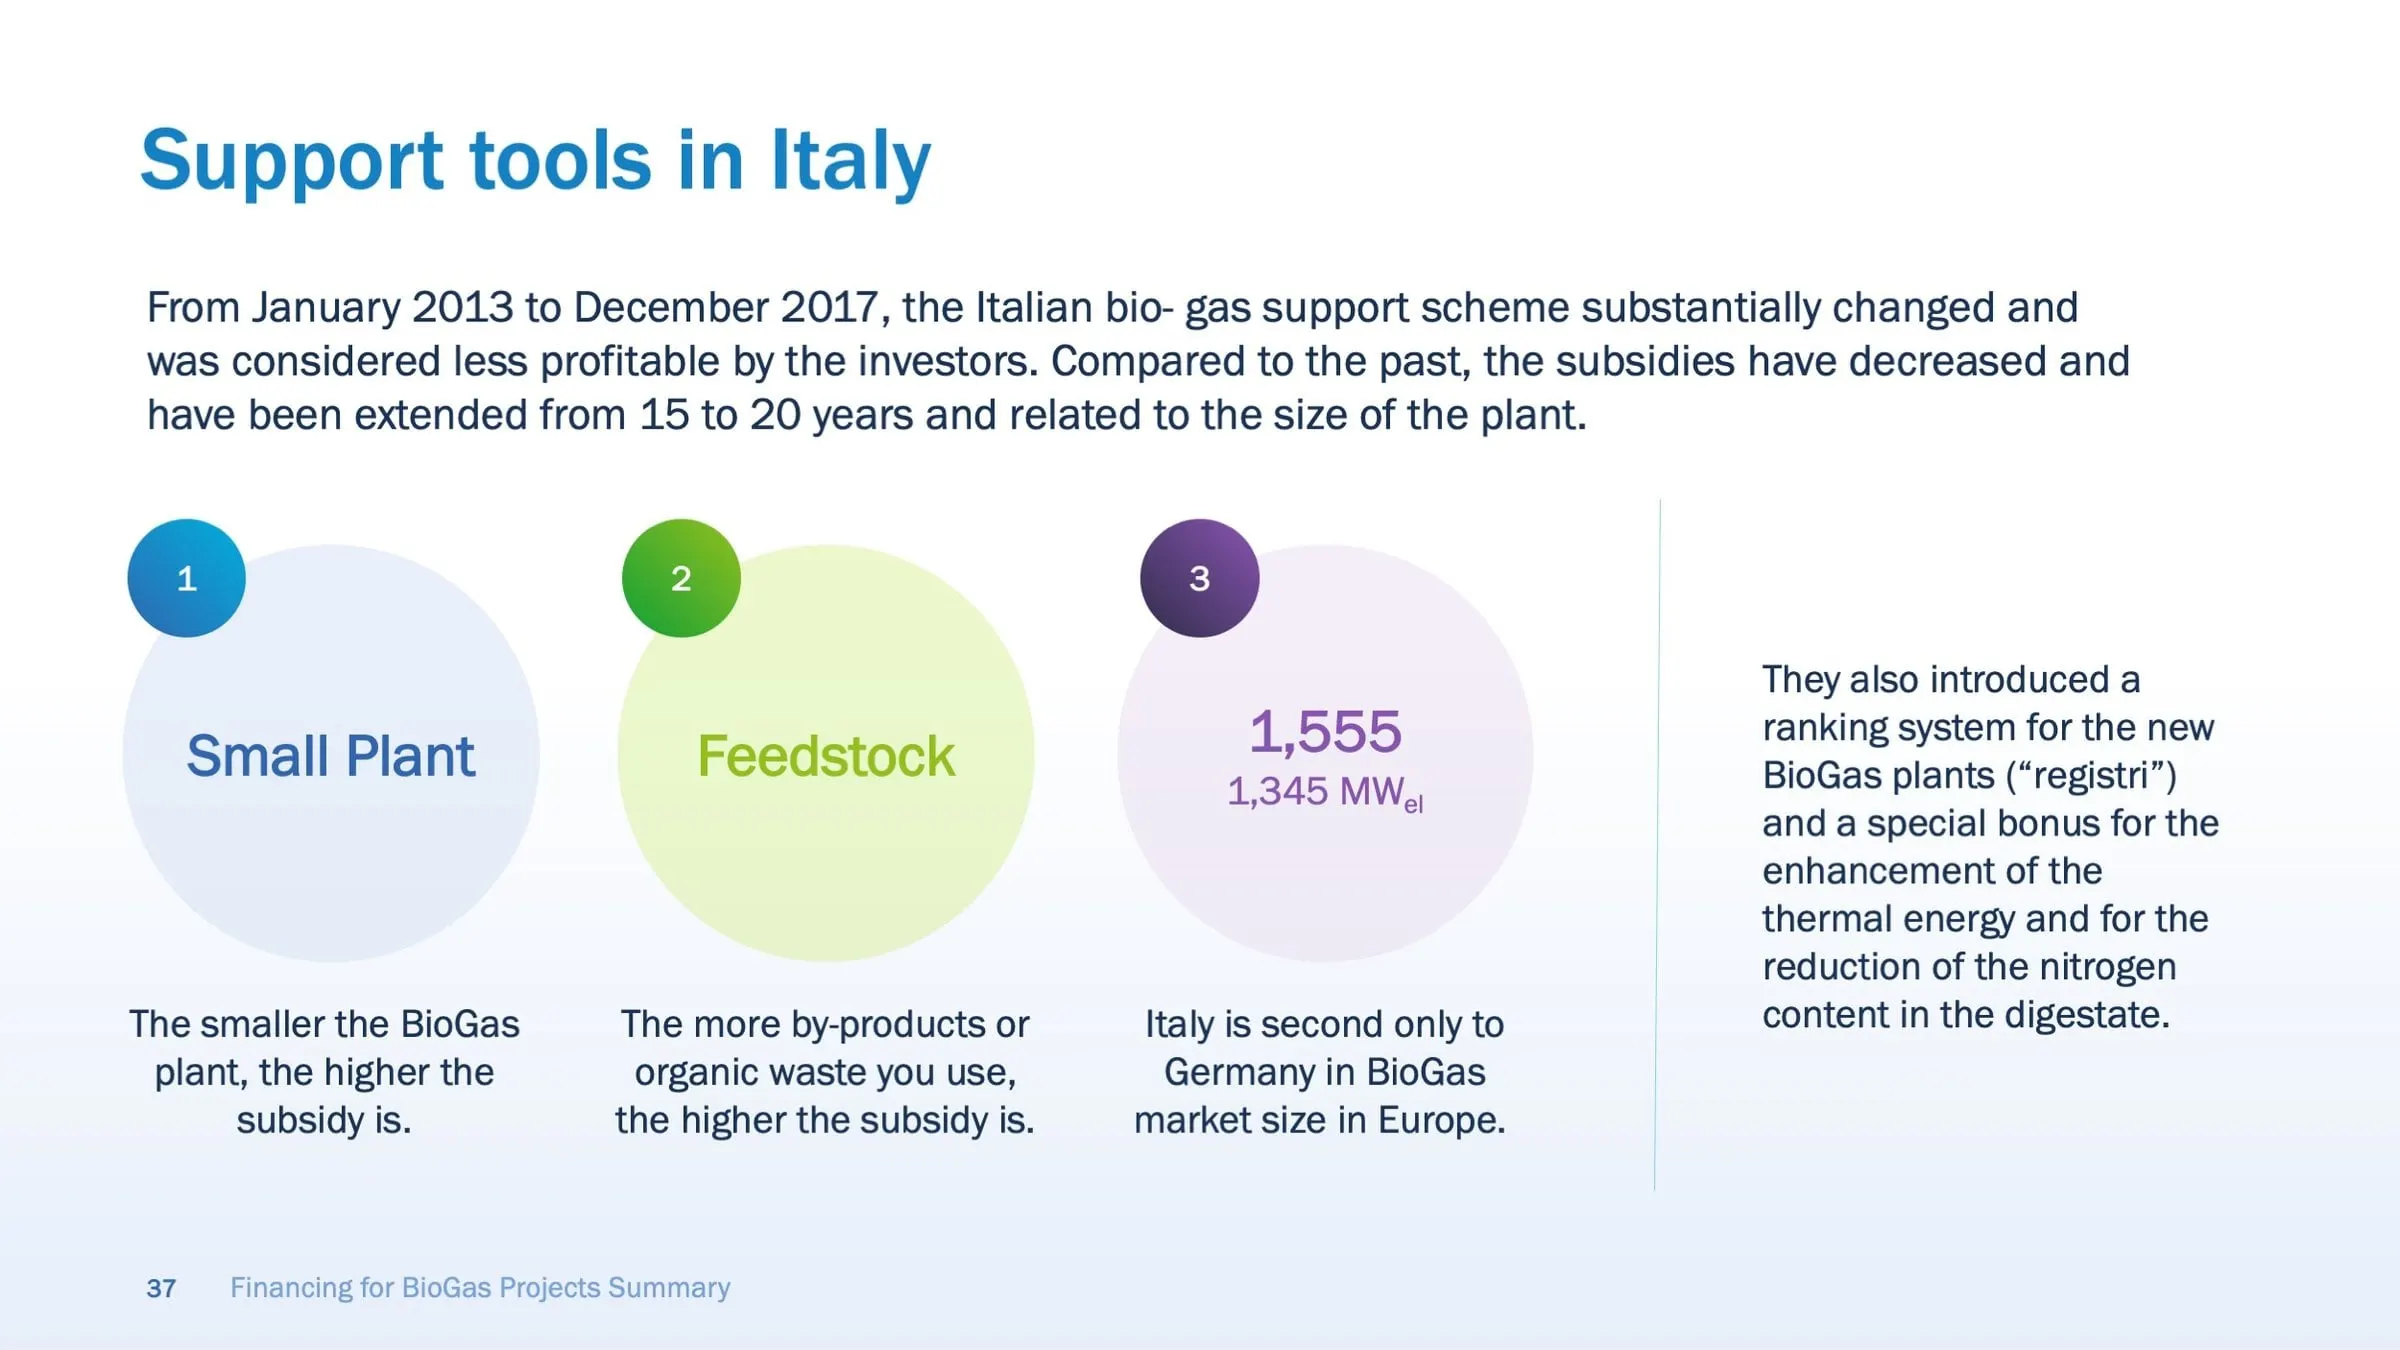
The country sections compare like with like: who typically invests (single farmers, farmer groups, municipalities, utilities and industry), how financing is usually arranged, which banks are active, and how the Italian subsidy scheme changed between 2013 and 2017. Statistics from the research sit in large circles with a short label beneath, rather than buried in body copy.
03 — Diagrams
Drawing the money: loans, equity and private debt
The hardest part of any finance deck is the mechanics. How does a traditional loan move between a bank and a plant operator? Where does company equity meet bank debt in a project financing model? Why would a growing company consider a minibond instead of private equity?
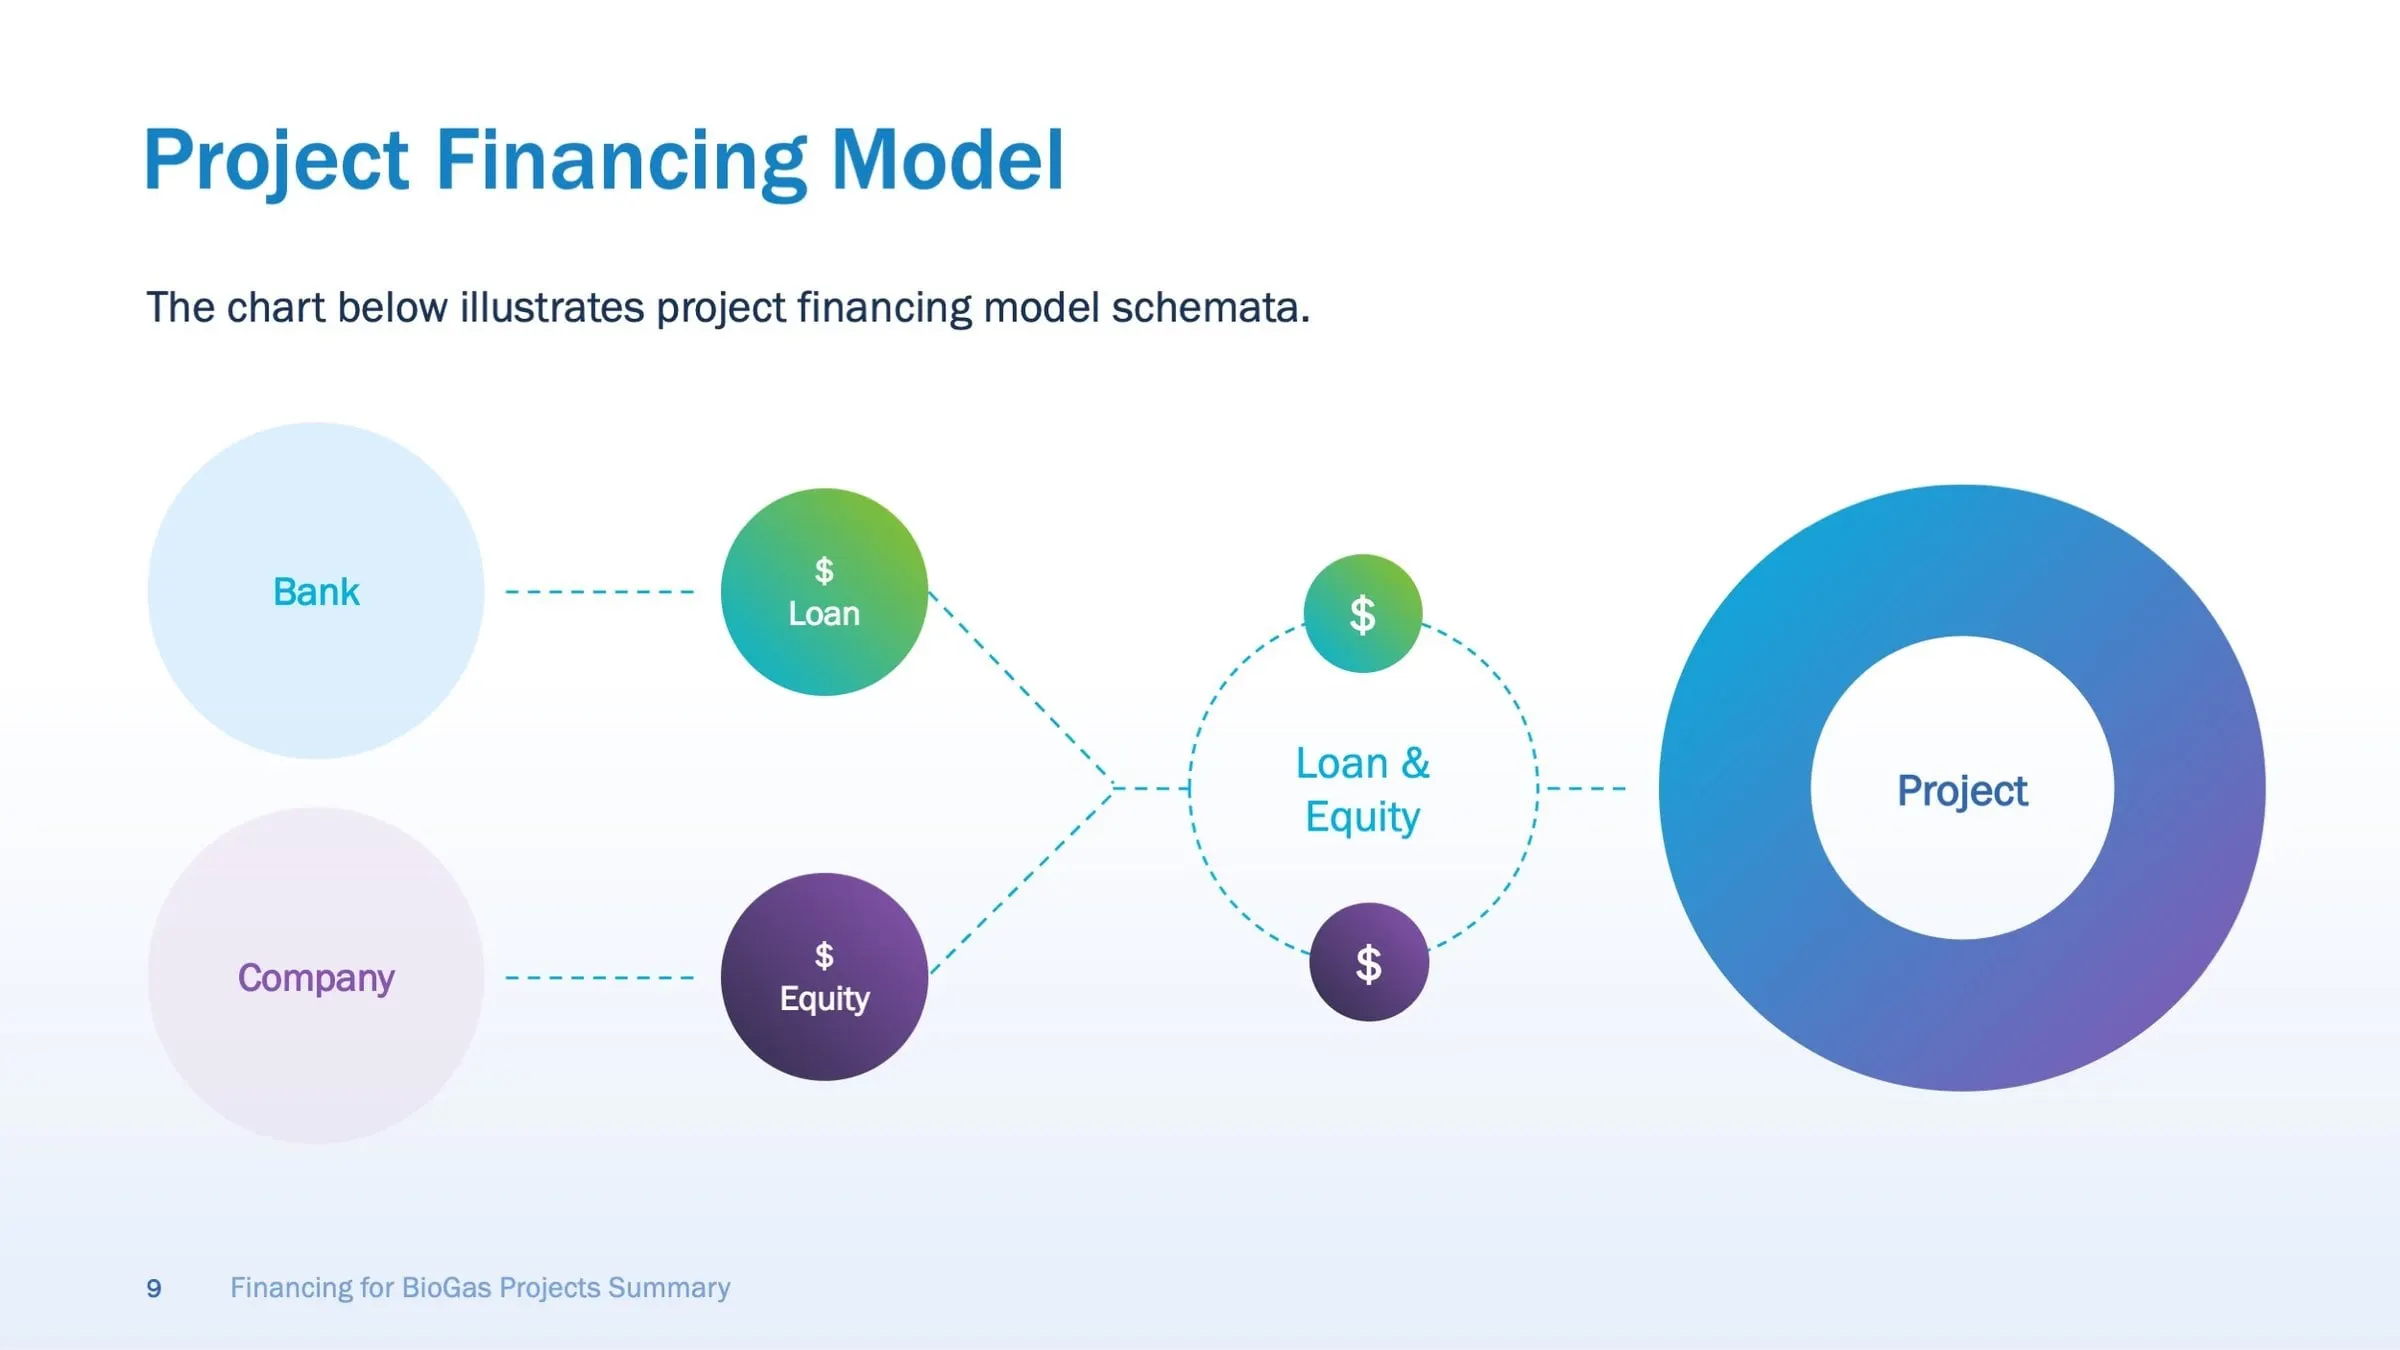
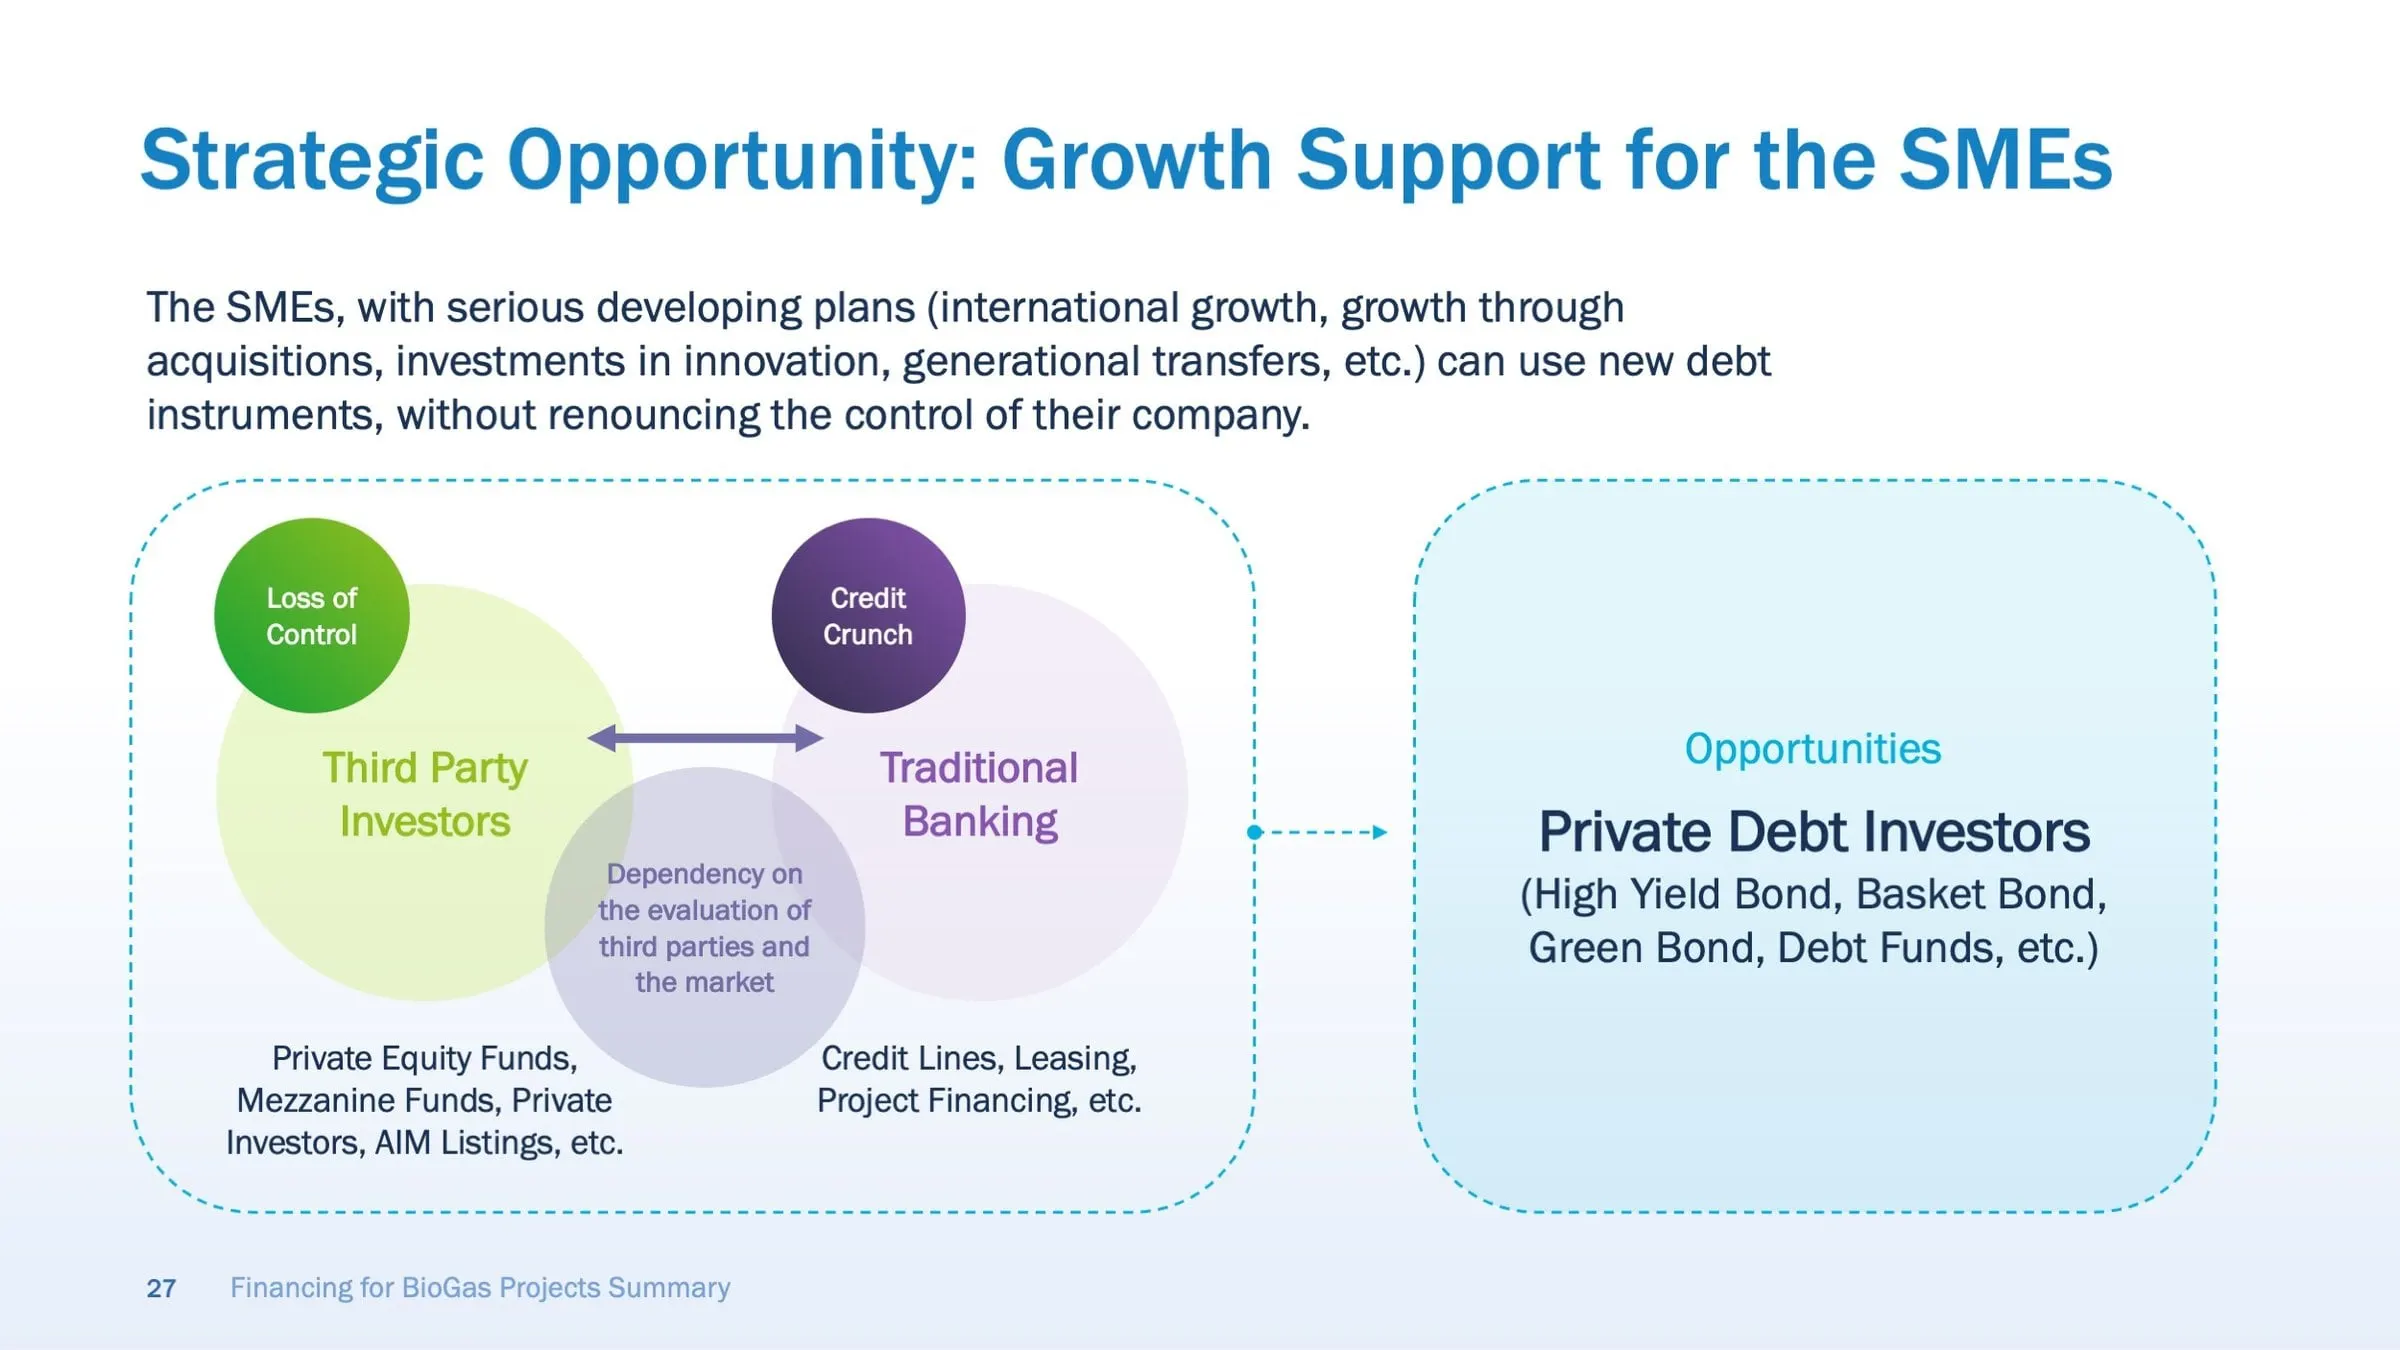
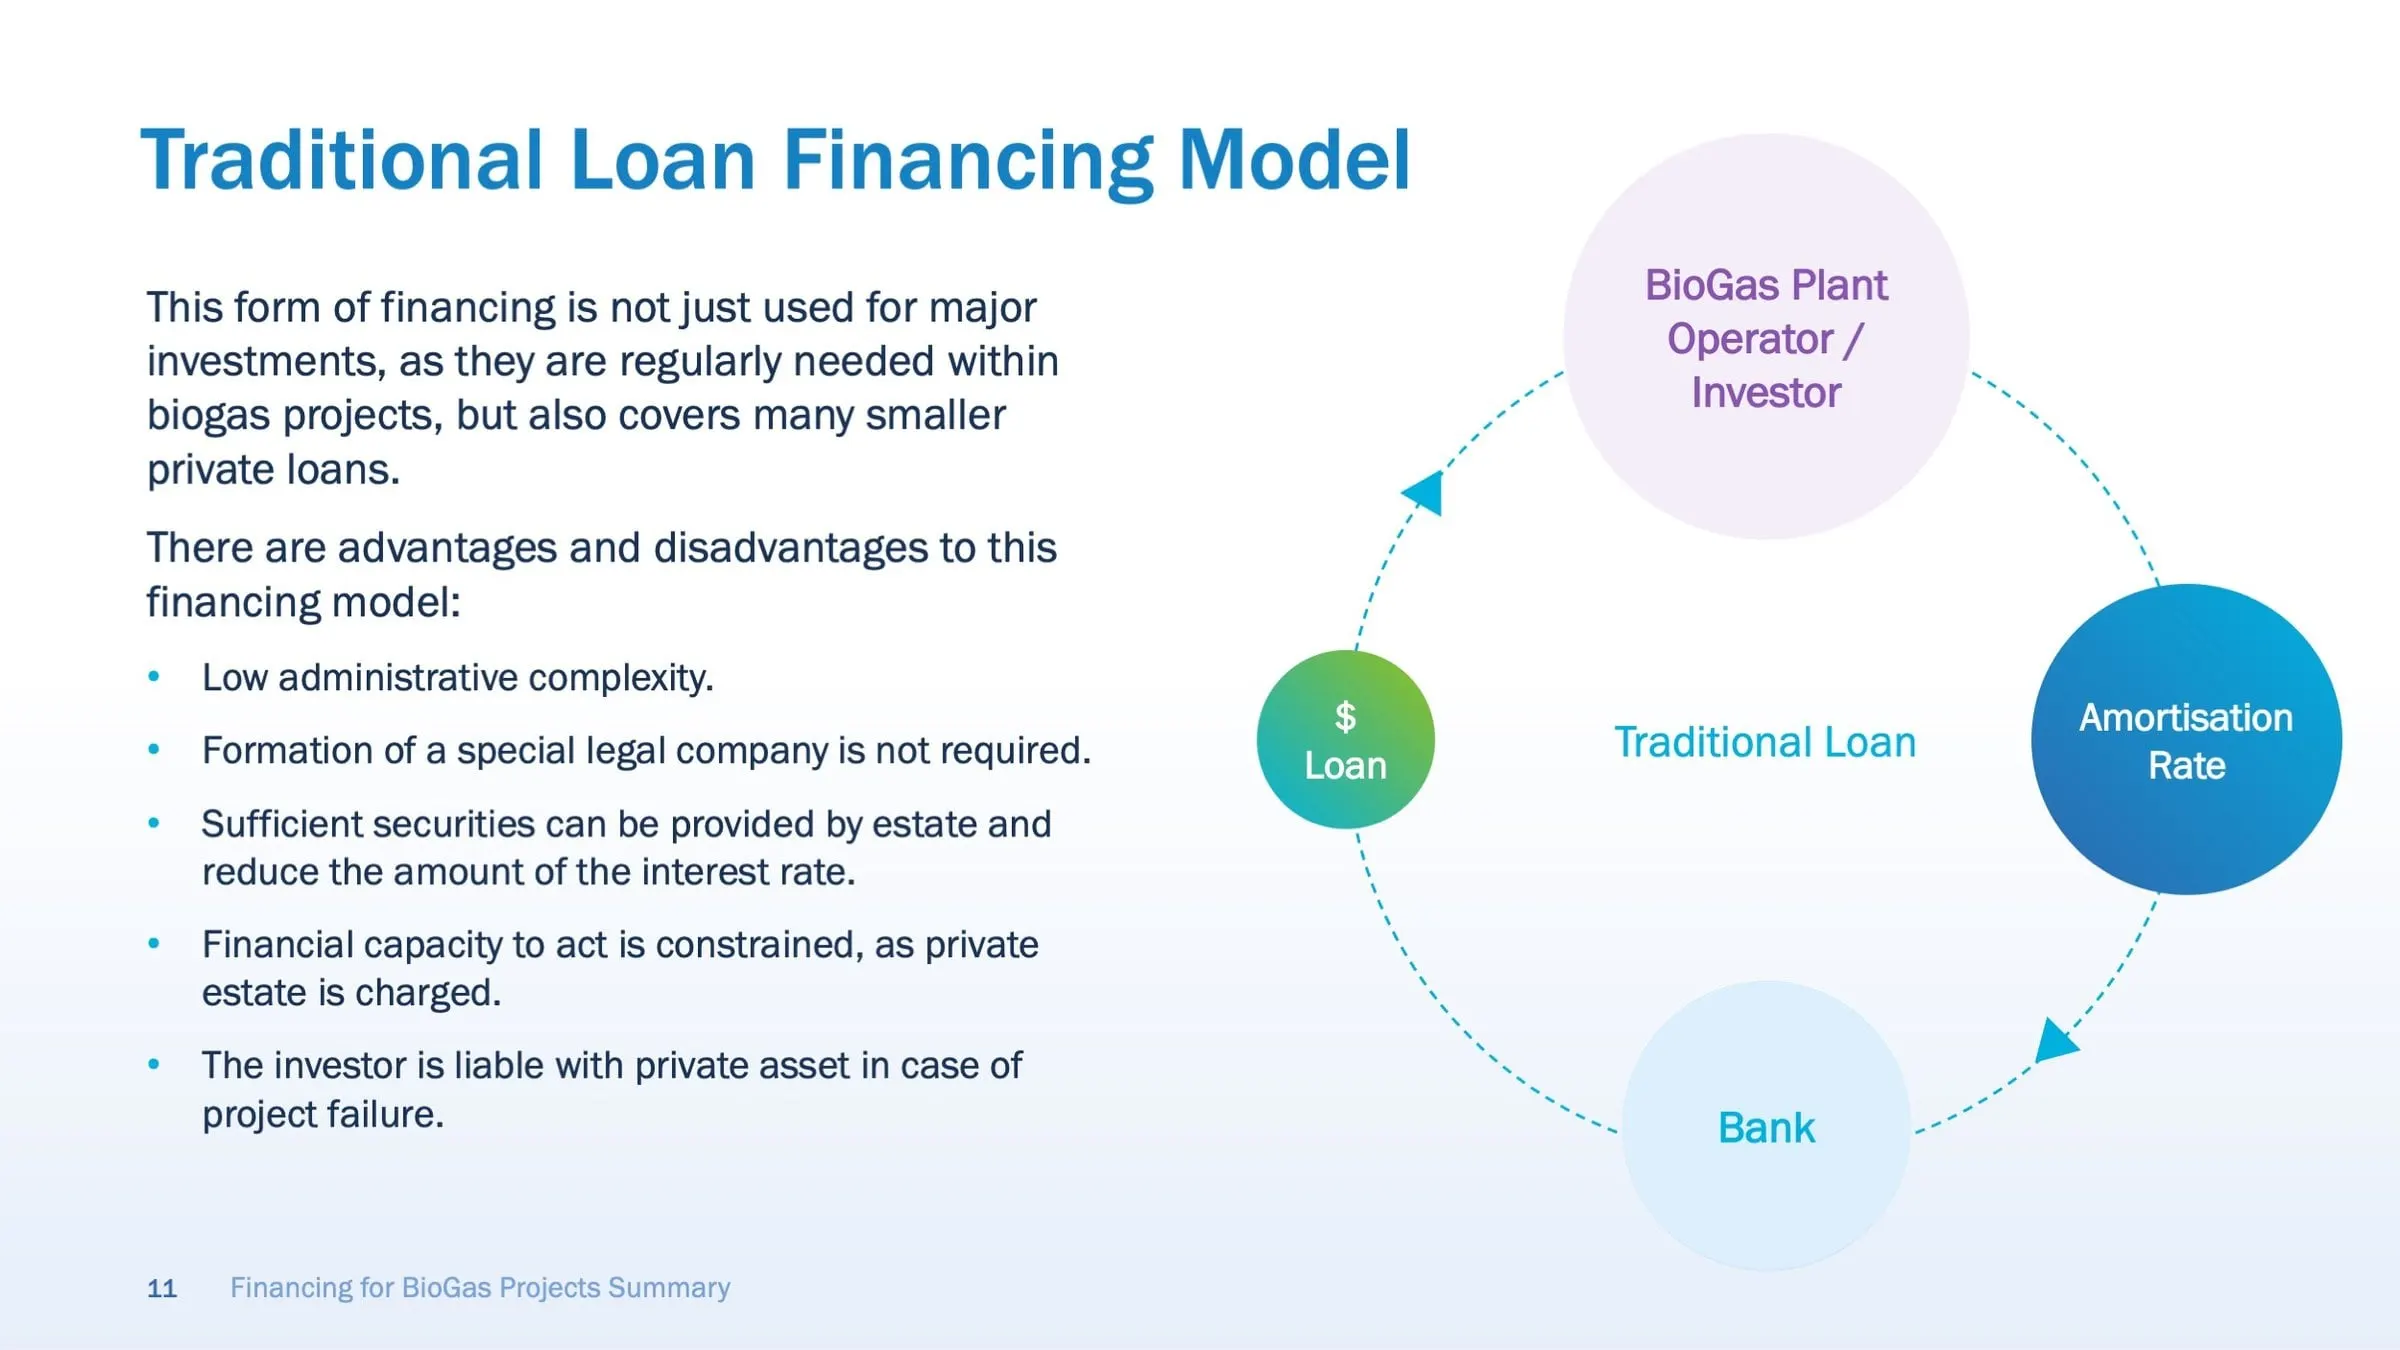
Text alone makes these feel heavier than they are, so we turned each model into a diagram. The traditional loan becomes a cycle: loan, plant operator, amortisation rate, bank. Project financing becomes two streams, loan and equity, joining before they reach the project. The strategic opportunity for small and mid-sized companies is a Venn of third-party investors and traditional banking, with private debt investors set apart as the alternative.
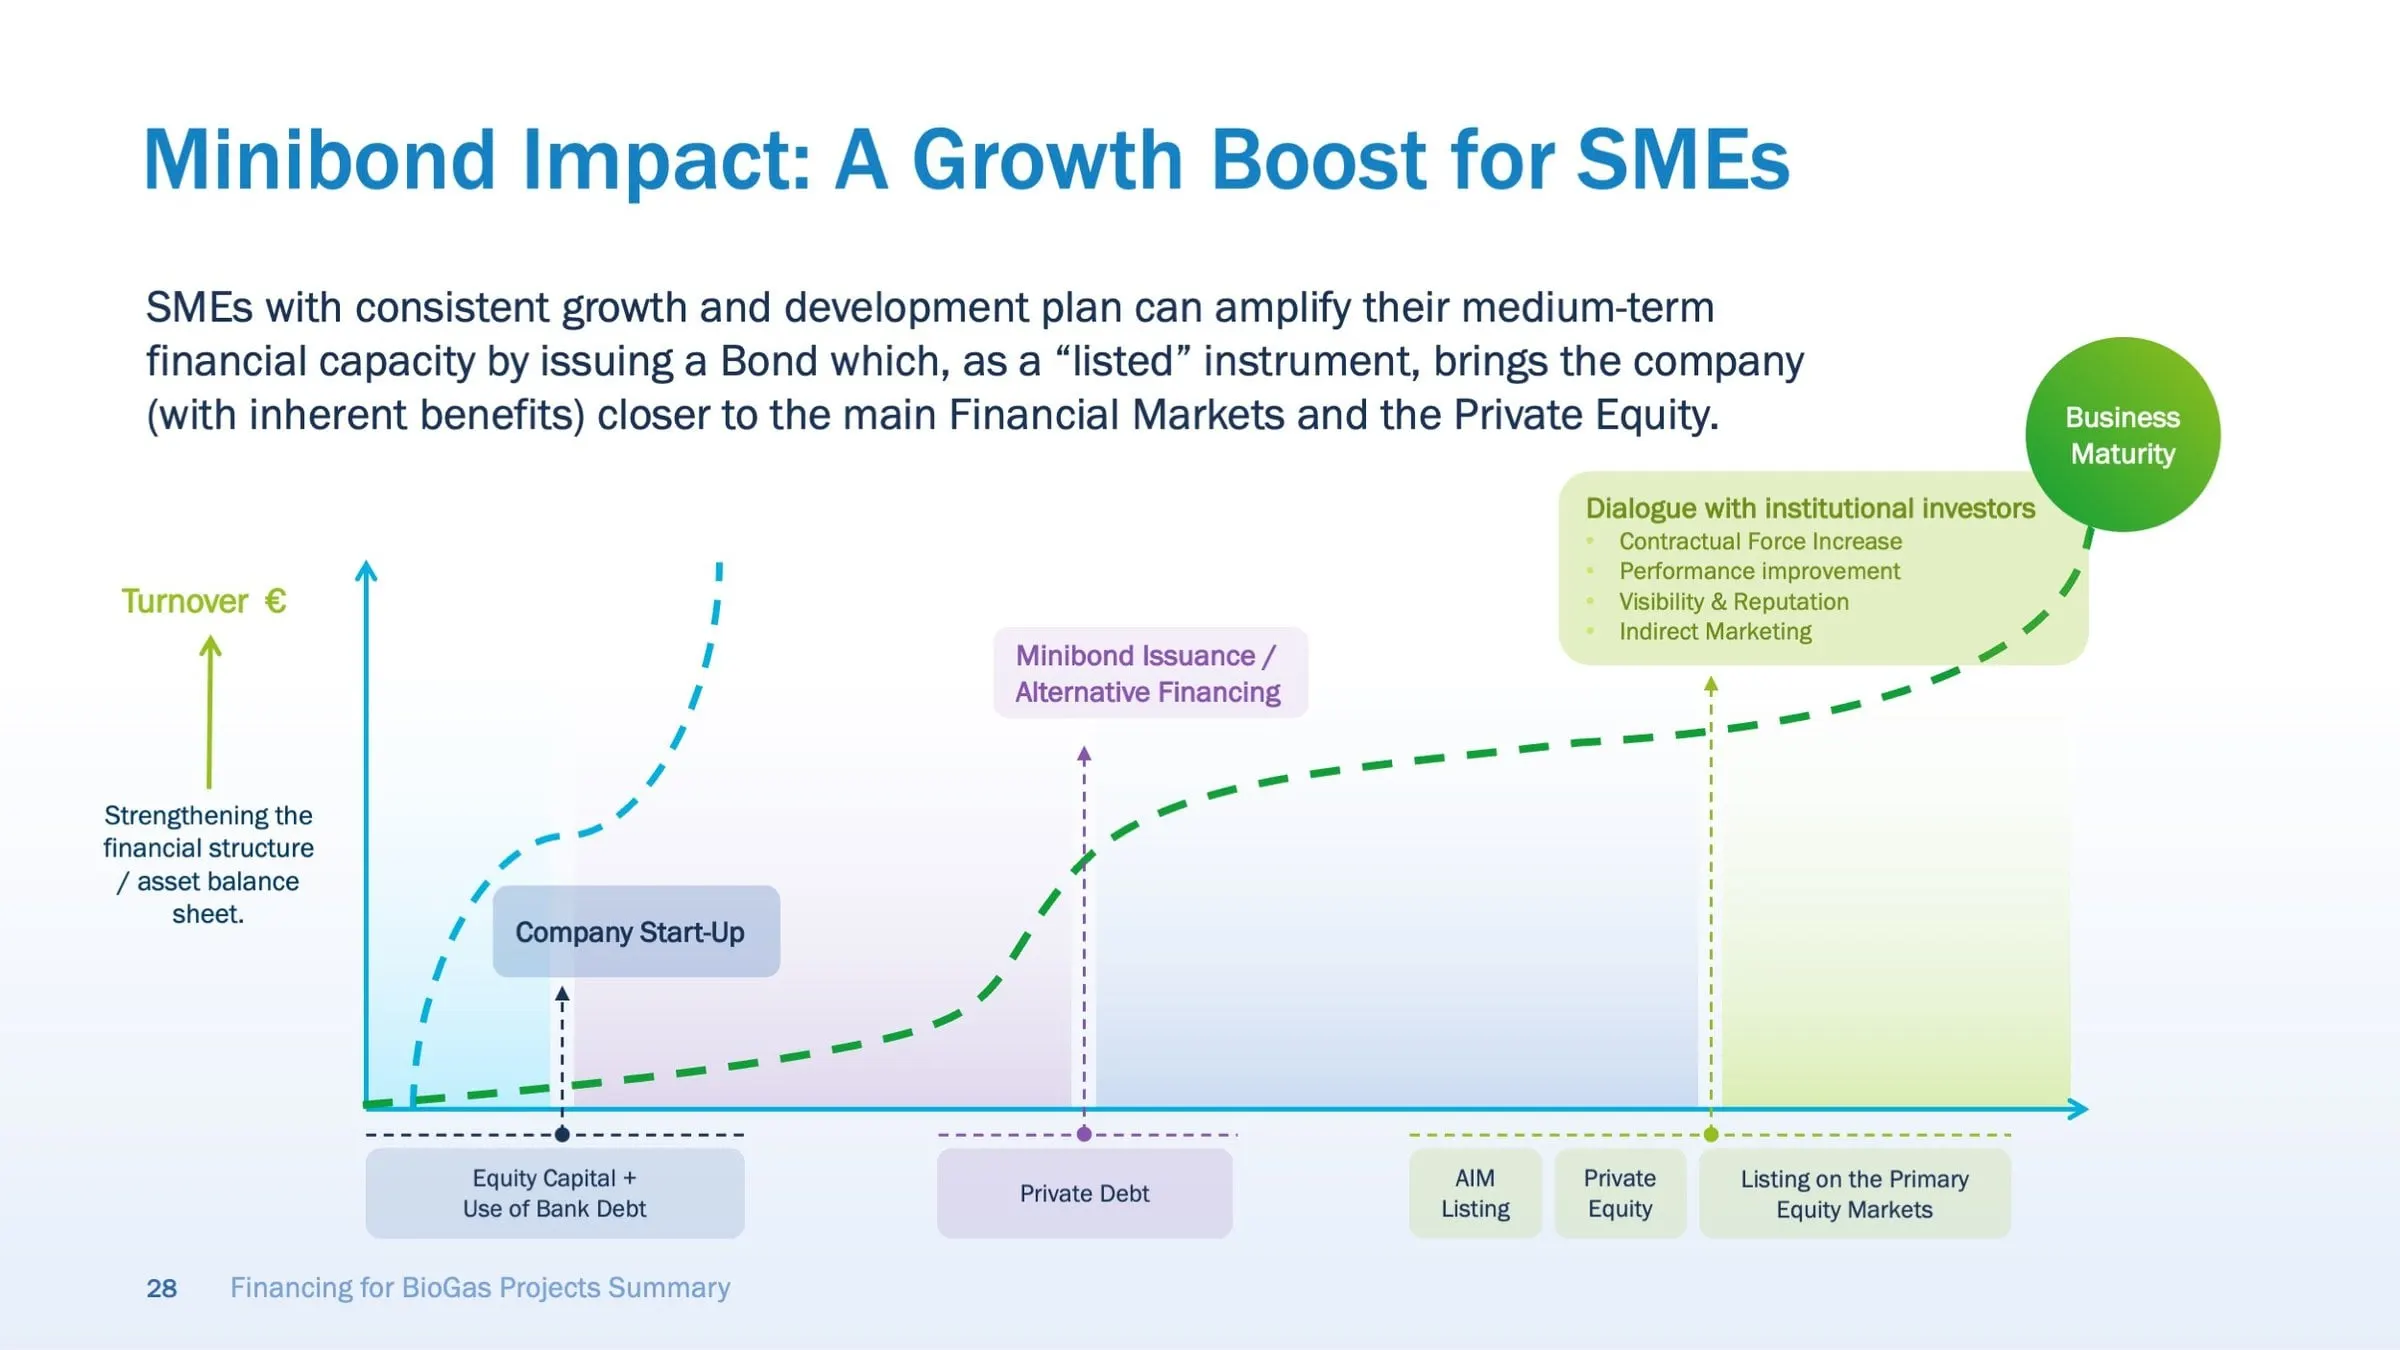
The minibond slide uses a growth curve with each financing stage marked along the timeline, from equity capital and bank debt through private debt to listing on the primary equity markets. This is where careful infographic design earns its keep: the investor sees the sequence before reading a word.
Advantages and disadvantages stay as short bullet lists beside the diagrams, so the detail is there for anyone who wants it without crowding the picture.
04 — System
A calm visual system for a long read
A deck this long needs rhythm. We kept content slides on a light background with a soft blue fade at the bottom, a bold blue headline at top left and the slide number and deck title in the footer. Section dividers flip to a full purple-to-blue gradient with overlapping green and blue rings, so a reader flicking through can see where one topic ends and the next begins.
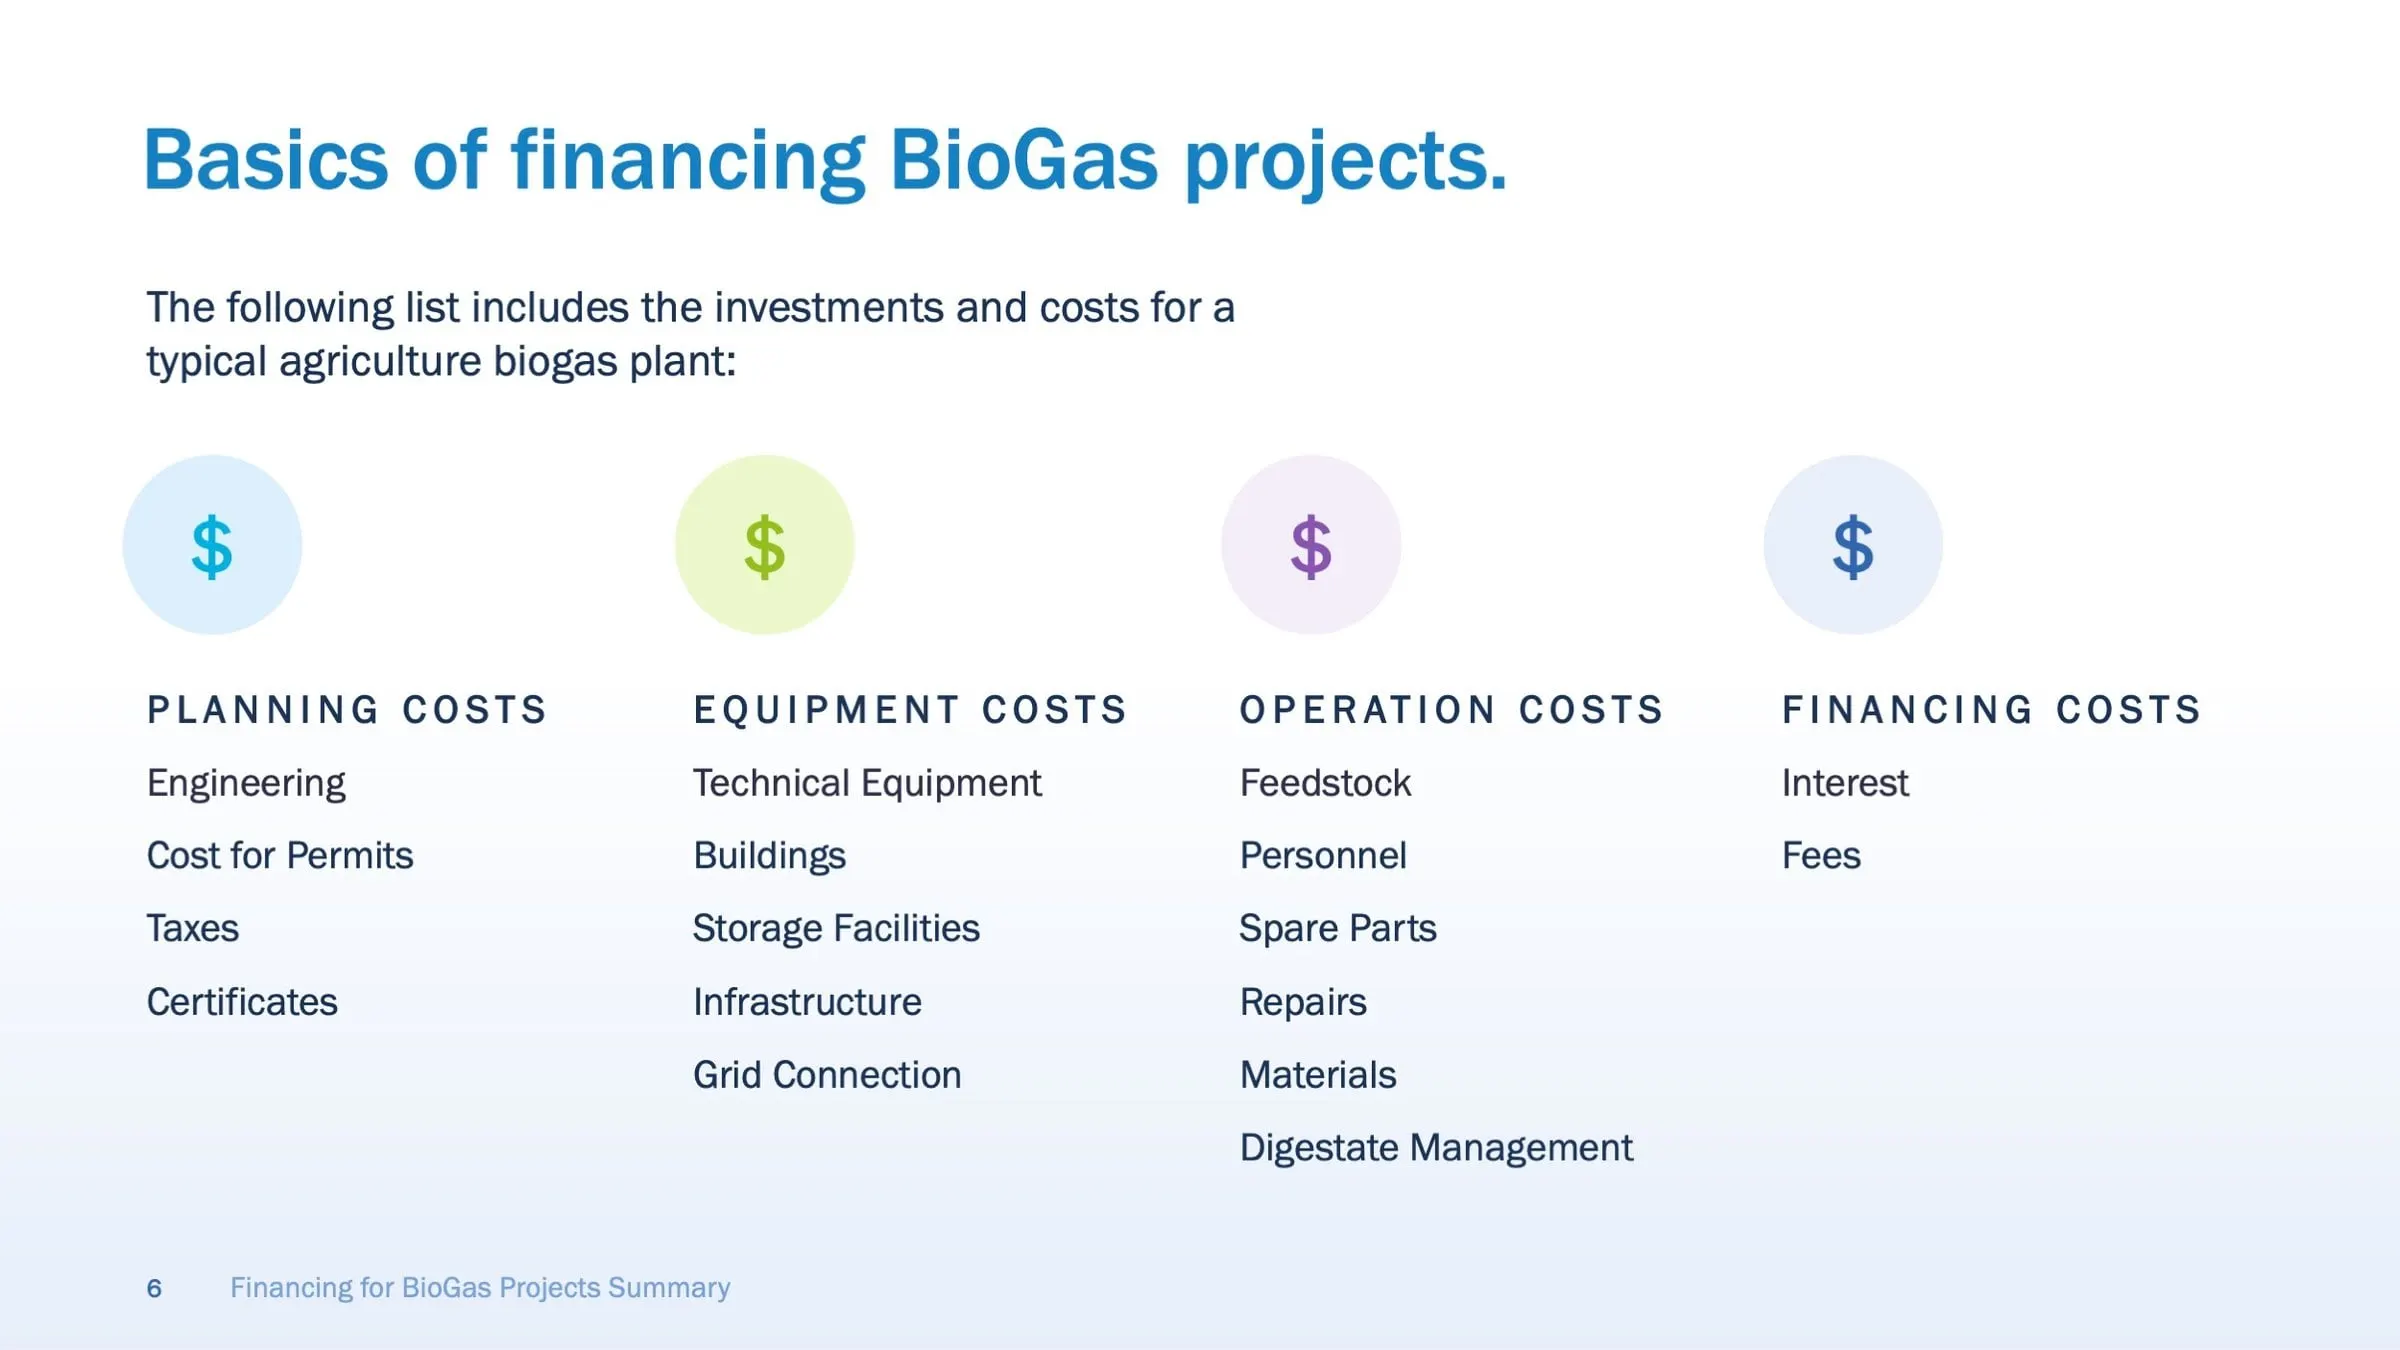
The palette borrows from the subject: greens and blues for clean energy, purple to tie the Italian material together. Cost categories for a typical agricultural plant (planning, equipment, operation and financing) each get a tinted icon and a letter-spaced heading, which makes a long list scannable.
The result is a presentation that works whether it is sent ahead of a meeting or presented live. For other examples of finance decks, see our Fortified Retirement presentation and the investor materials we designed for ILA Capital.
What we delivered
A complete investor deck, built as an editable PowerPoint file.