Annual Report Design
Your year, told well.
Annual and impact reports that turn numbers into a story your board, donors, investors and team will actually read.
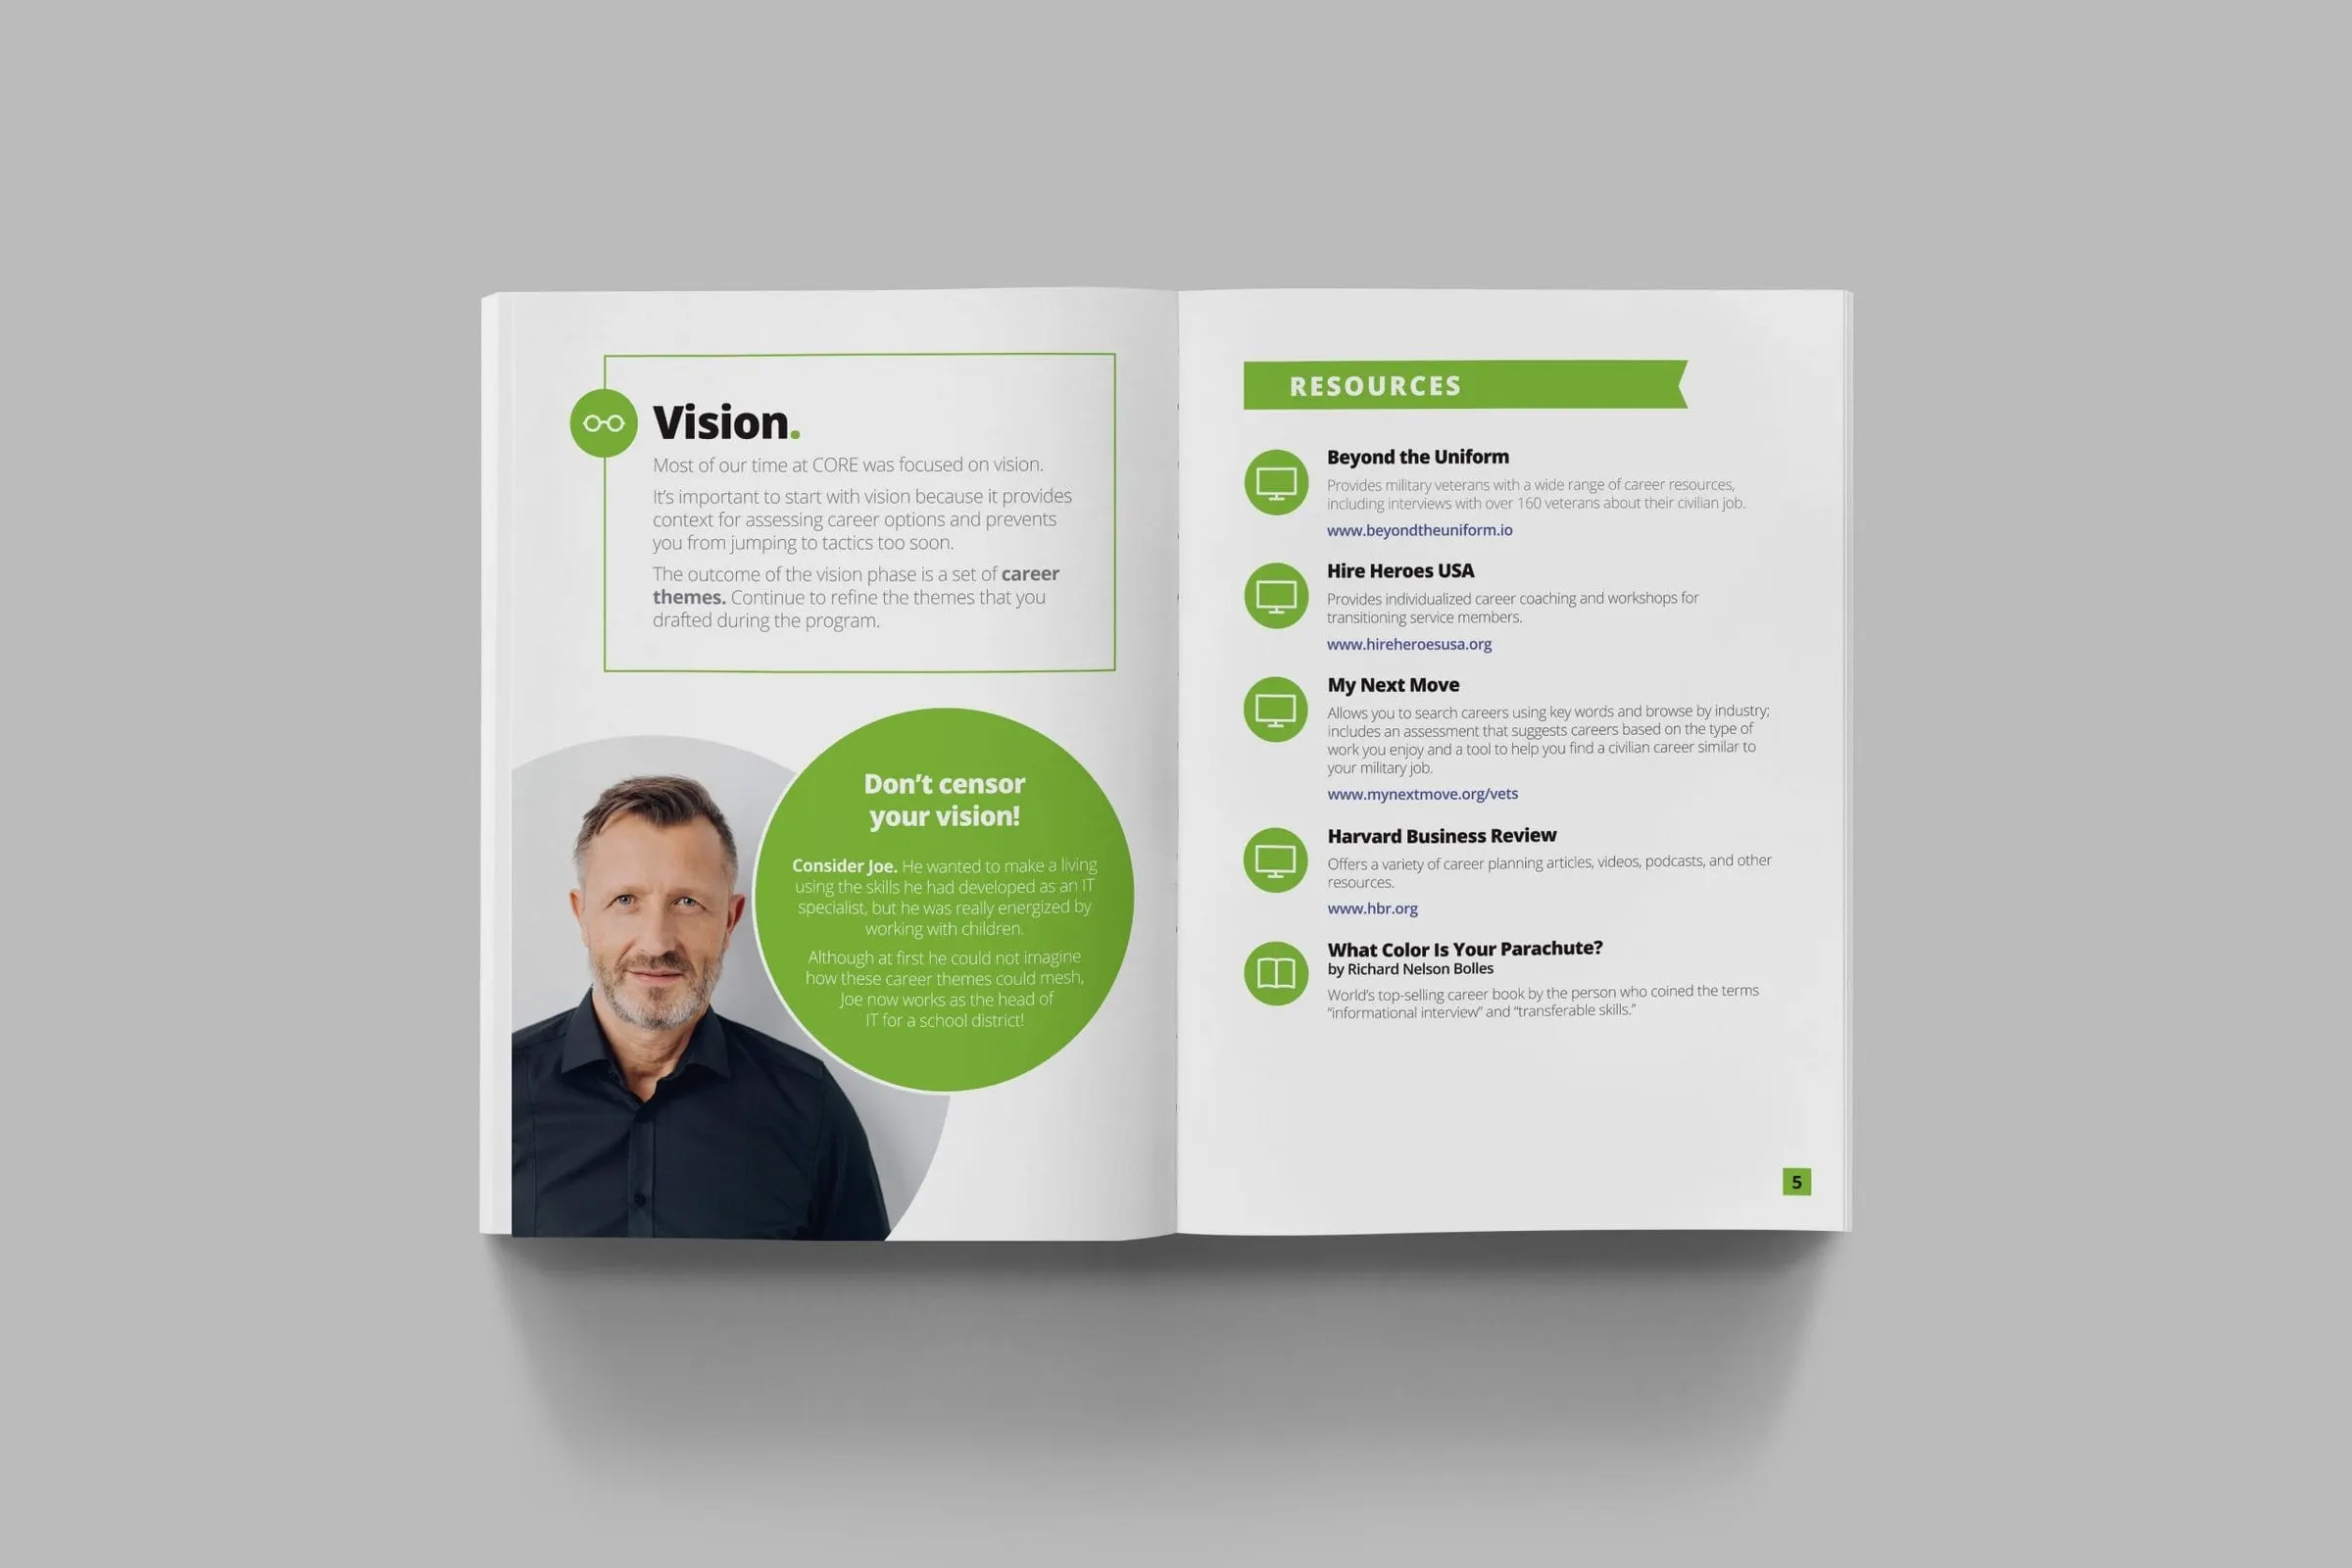
An annual report is your best chance to show what a year of hard work added up to. Too often it’s a wall of text and a few default charts. We design reports that make progress visible and make people proud to share them.
What is annual report design?
Numbers with a narrative.
Annual report design is the design of the documents organizations publish to report on a year or program: annual reports, impact reports, progress reports and strategic plans. A good report balances story and data, with clear structure, strong visuals and charts that are easy to understand.
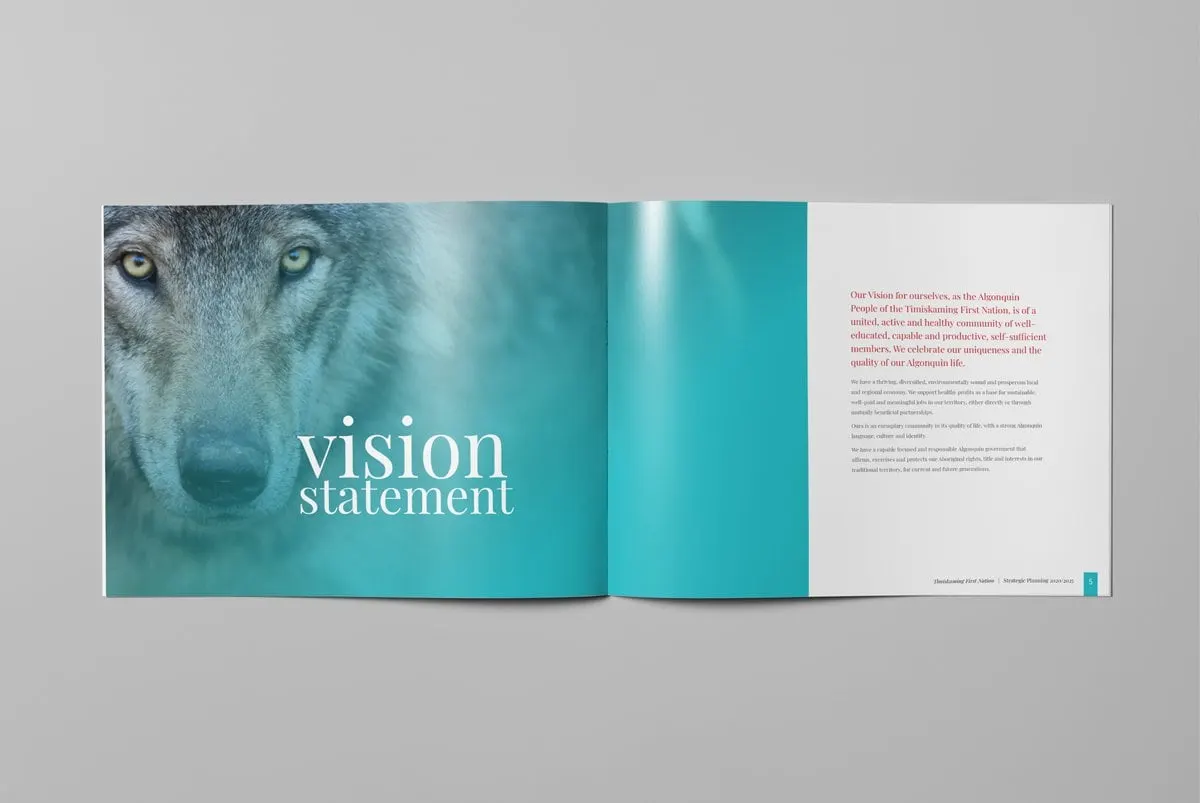
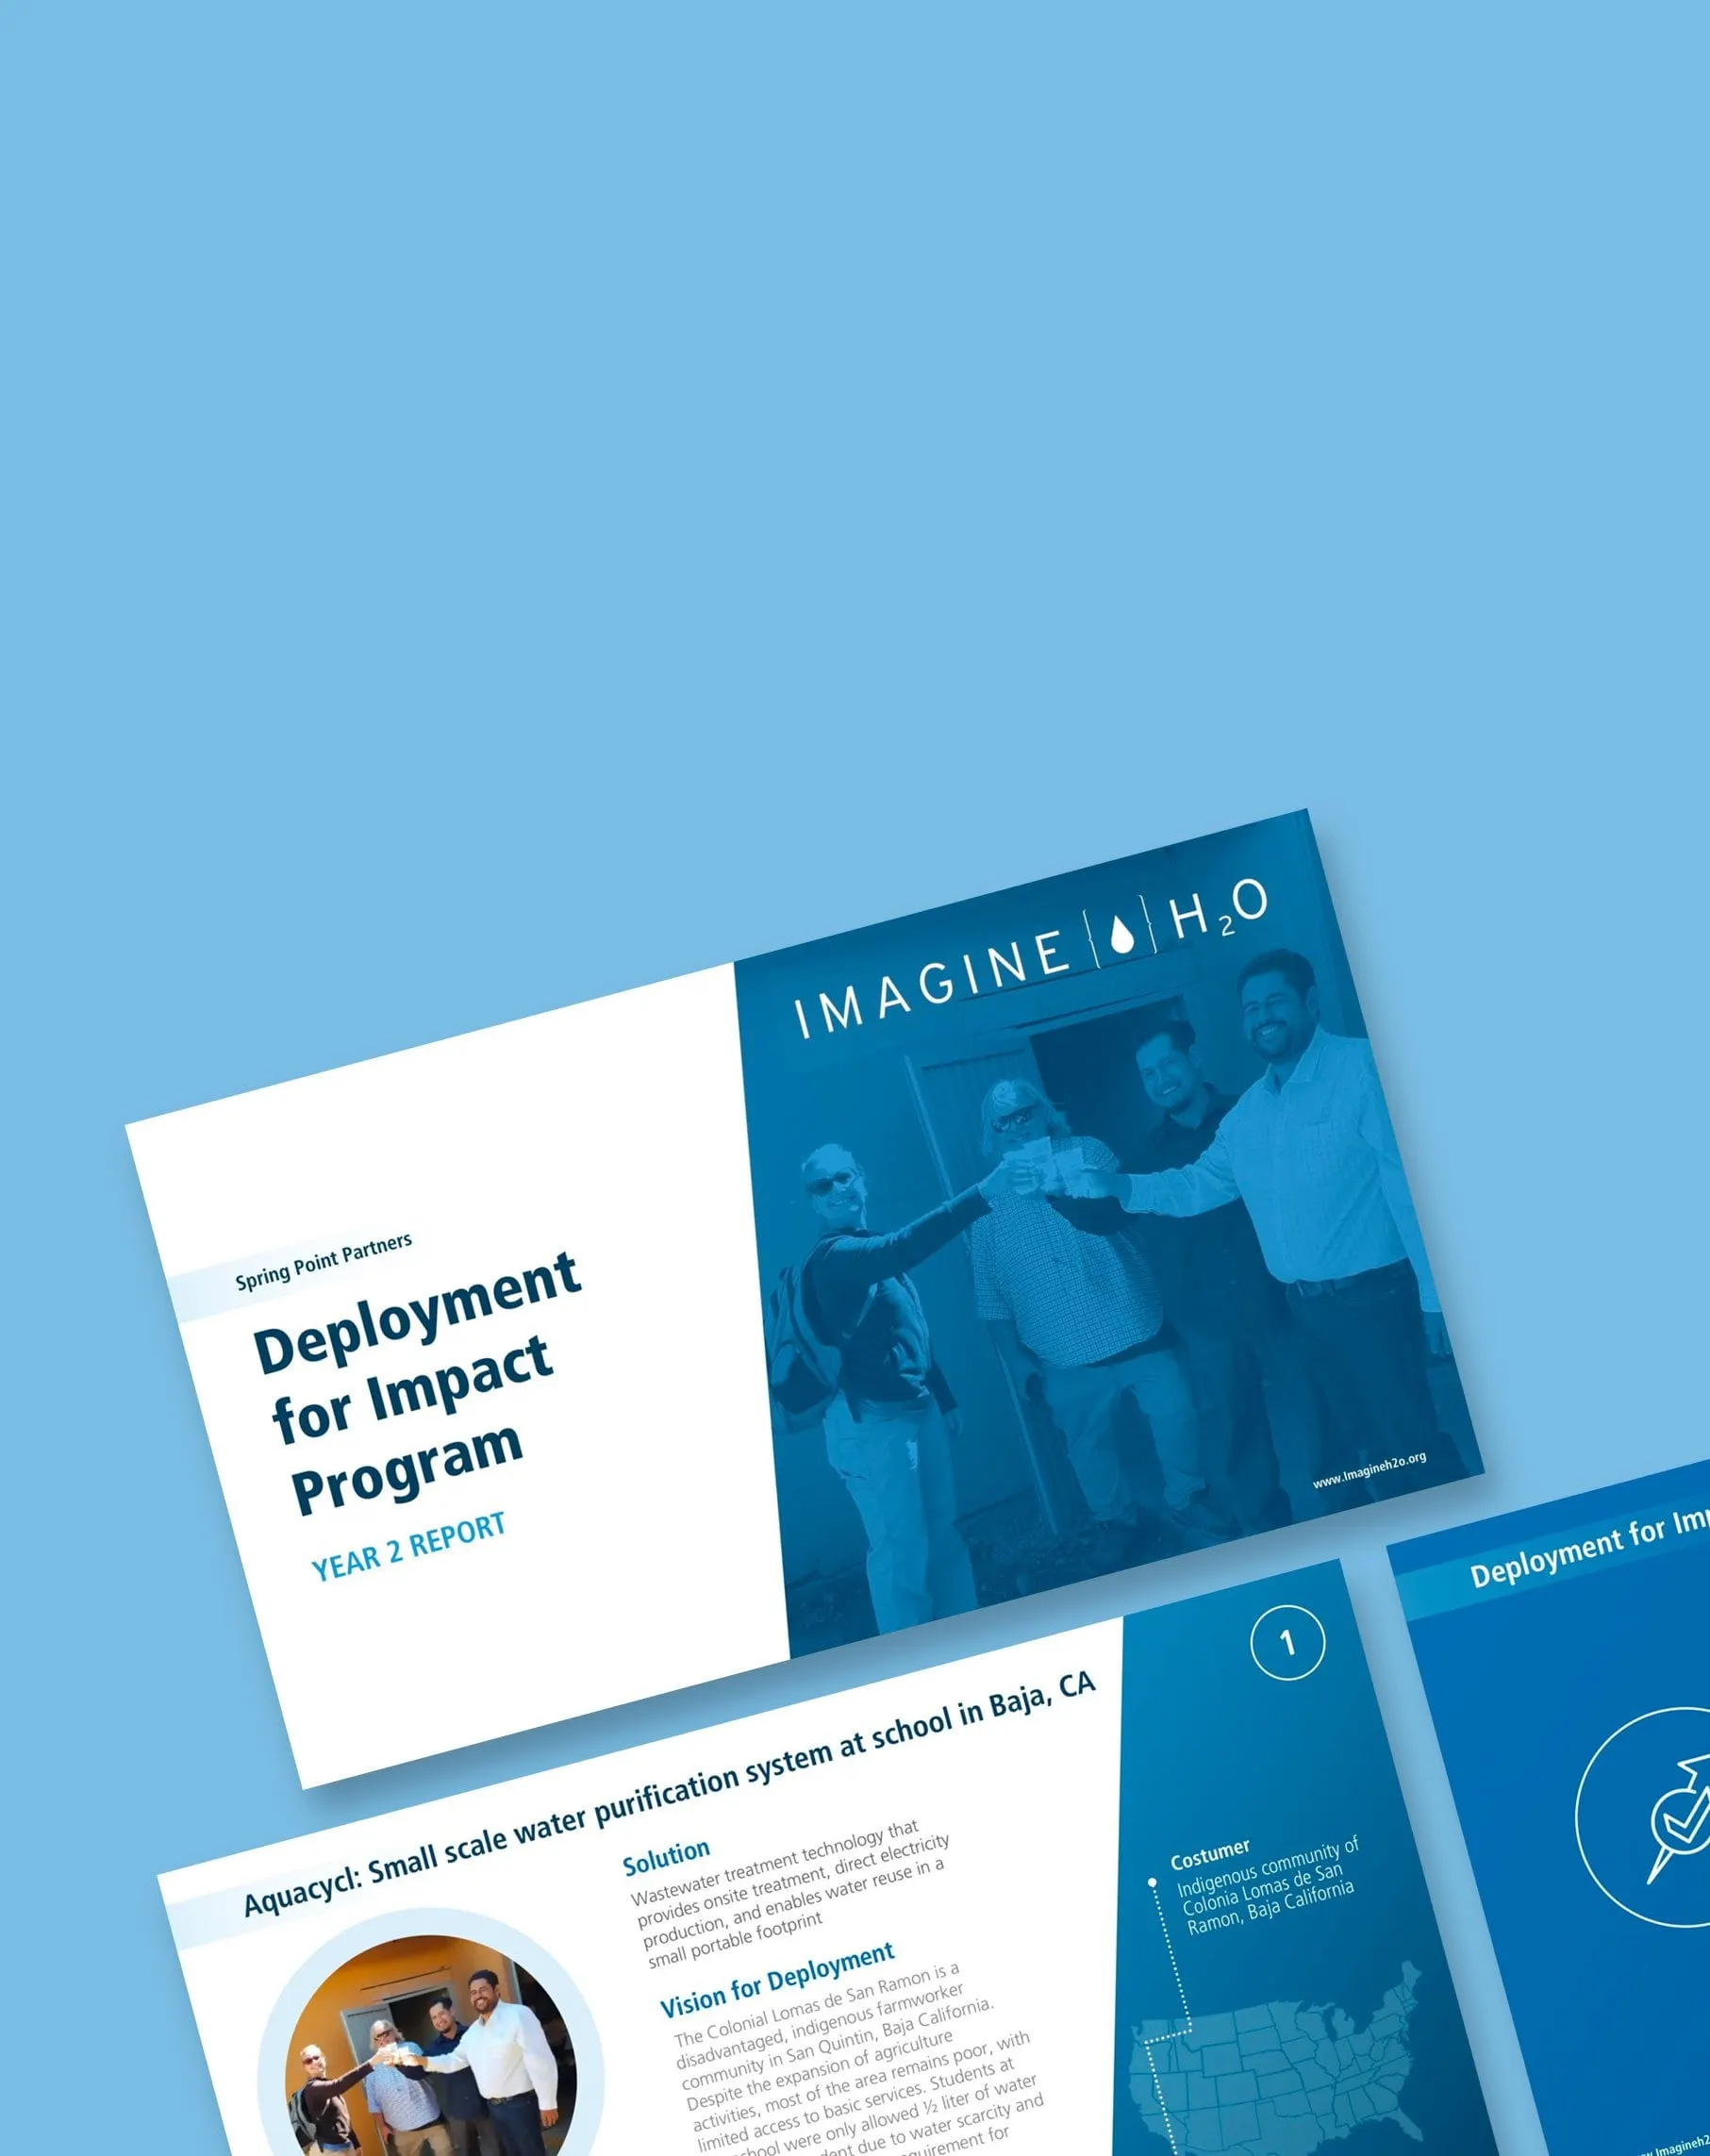
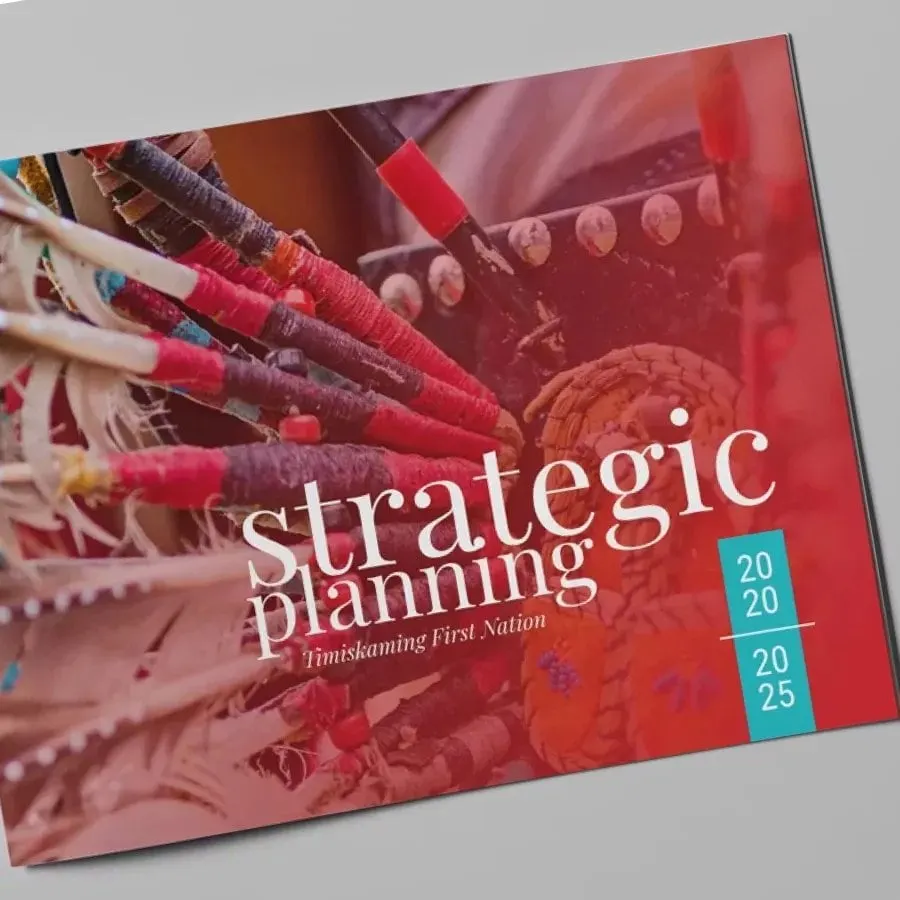
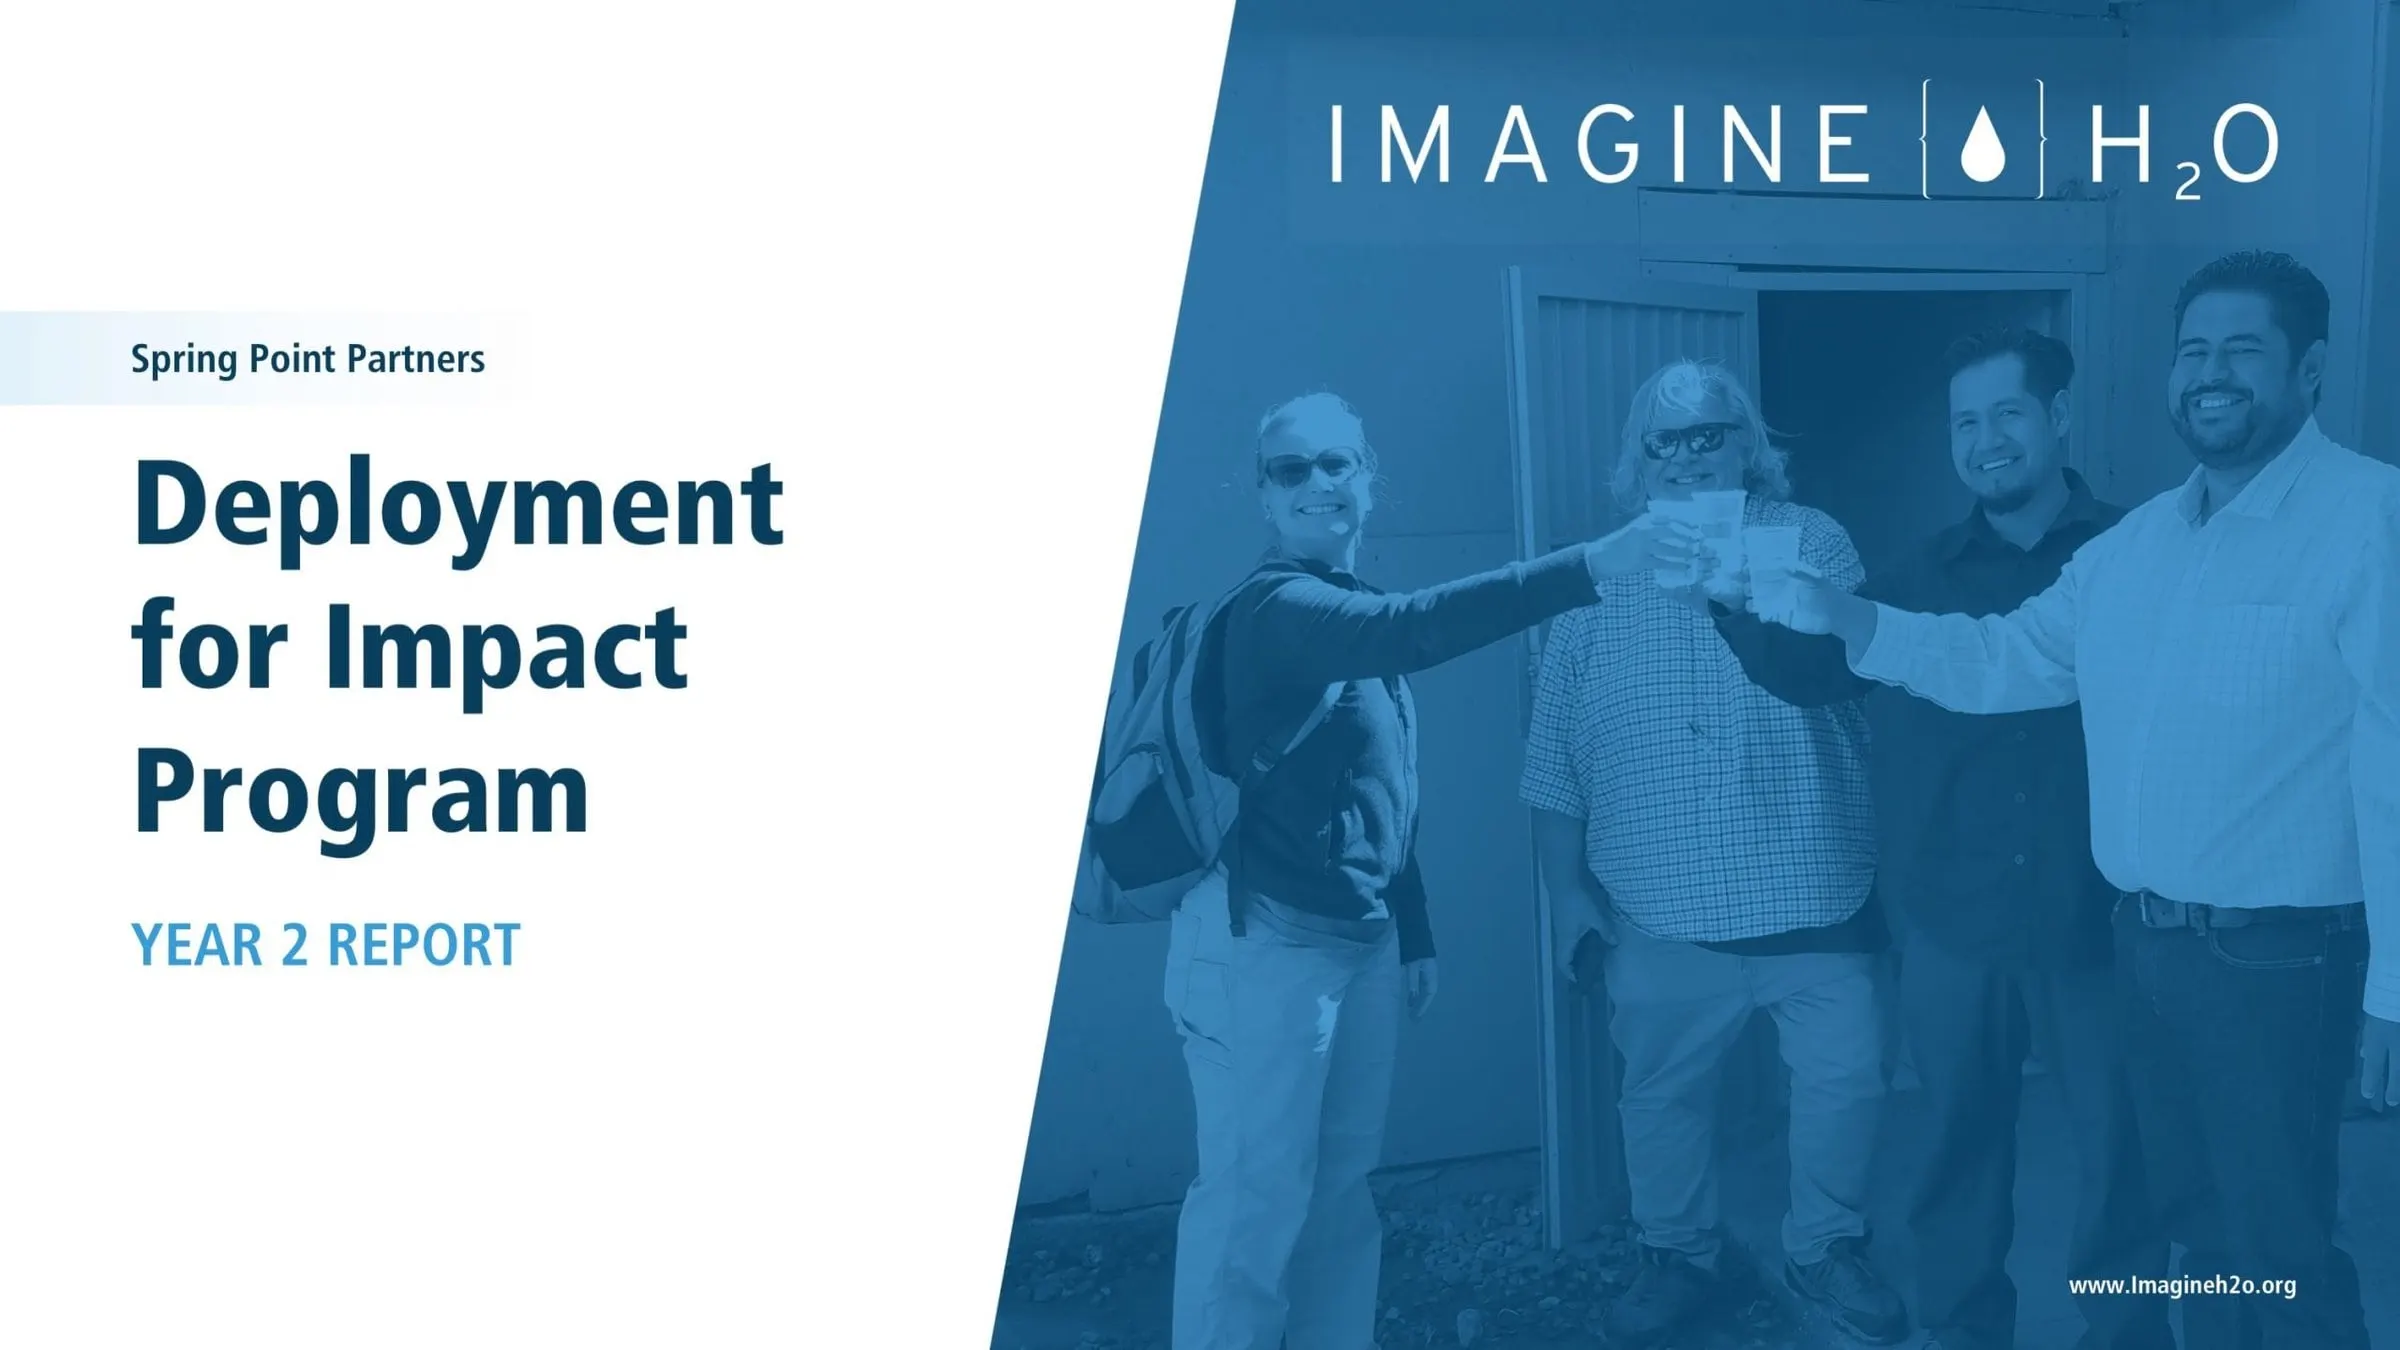
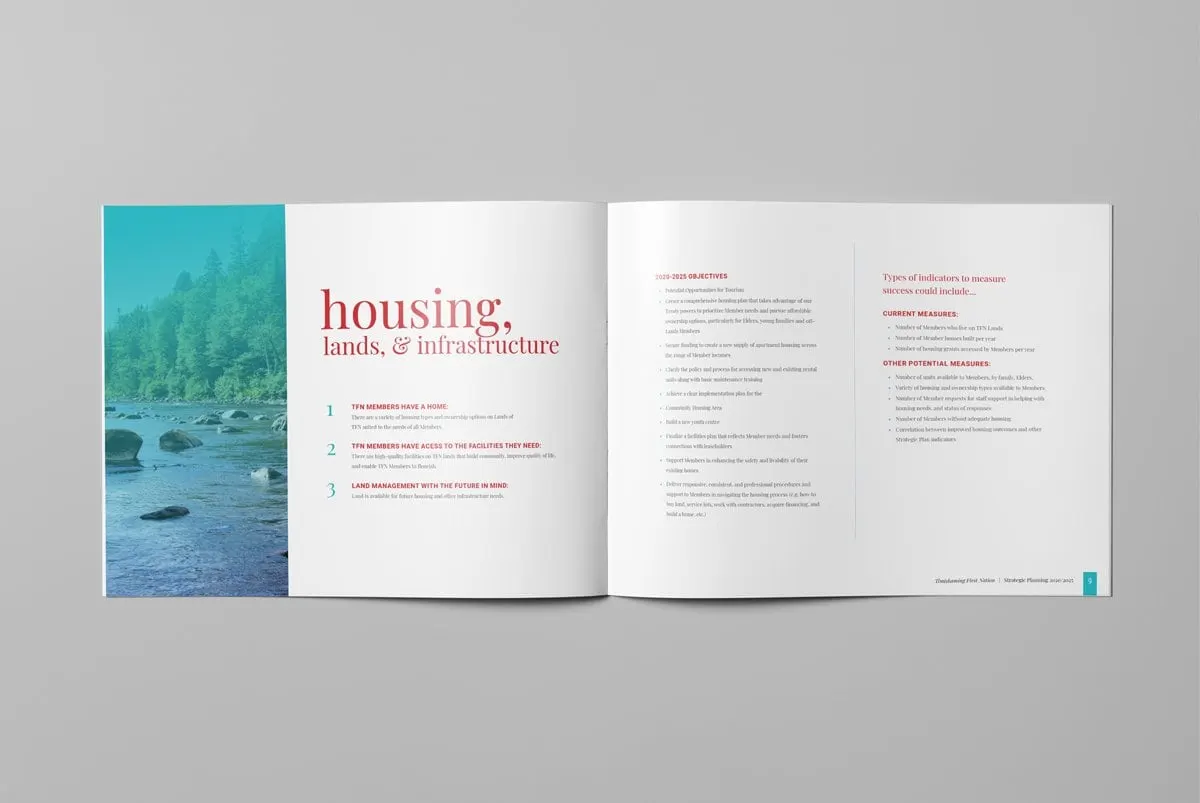
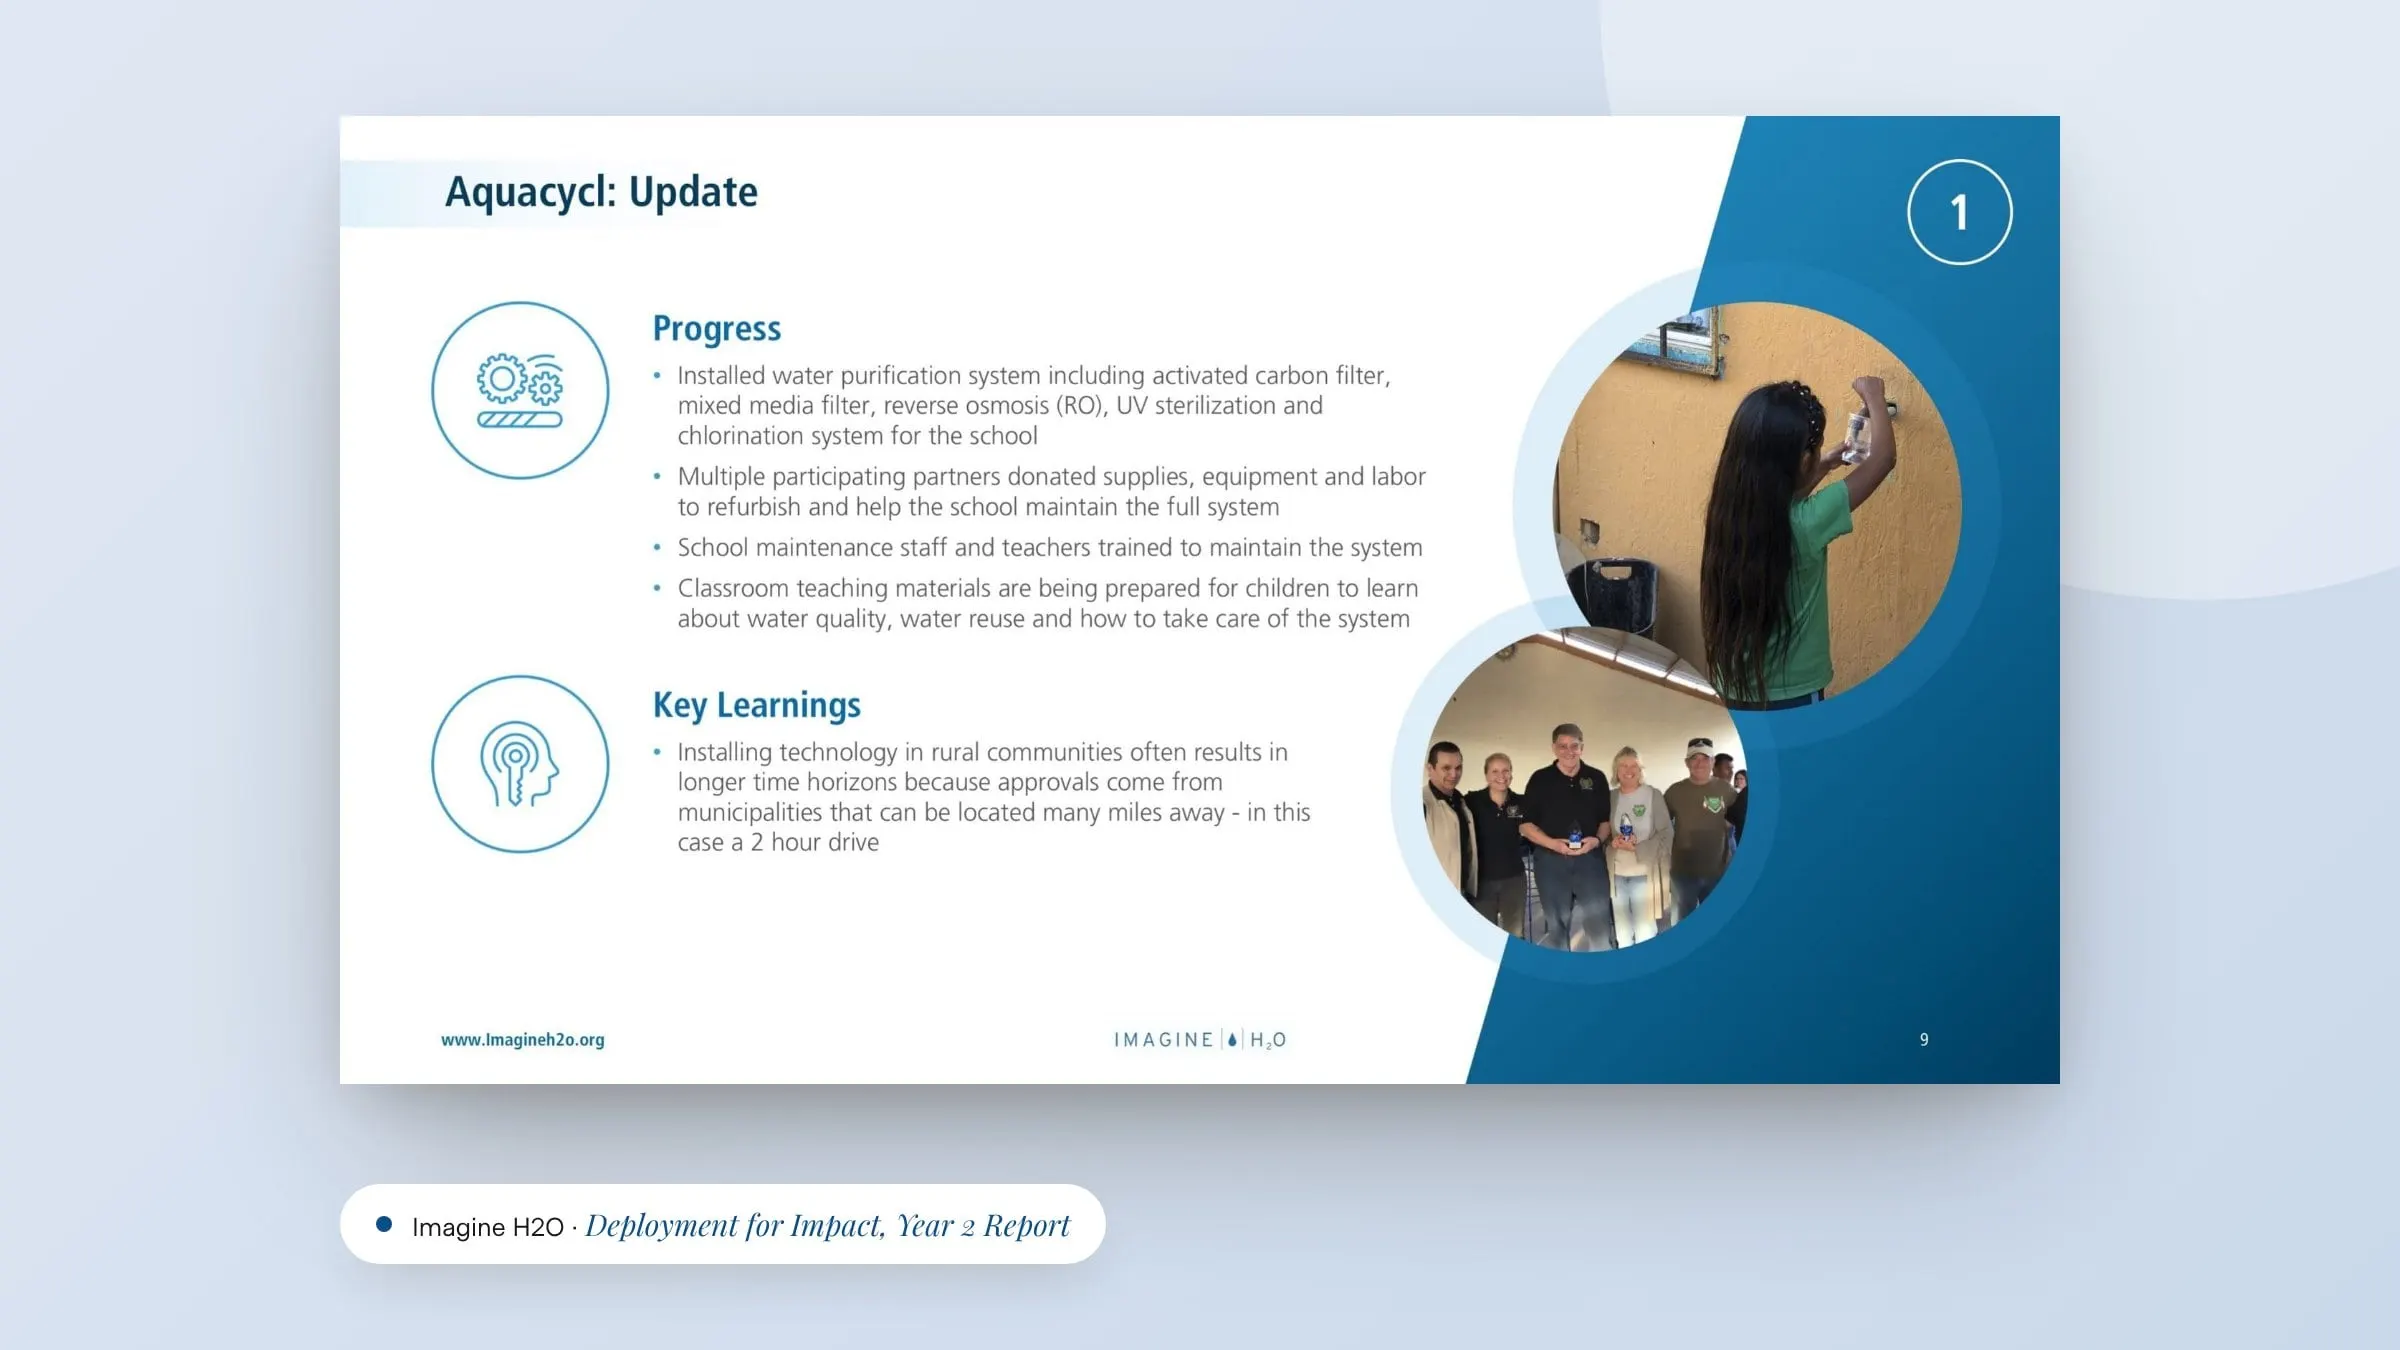
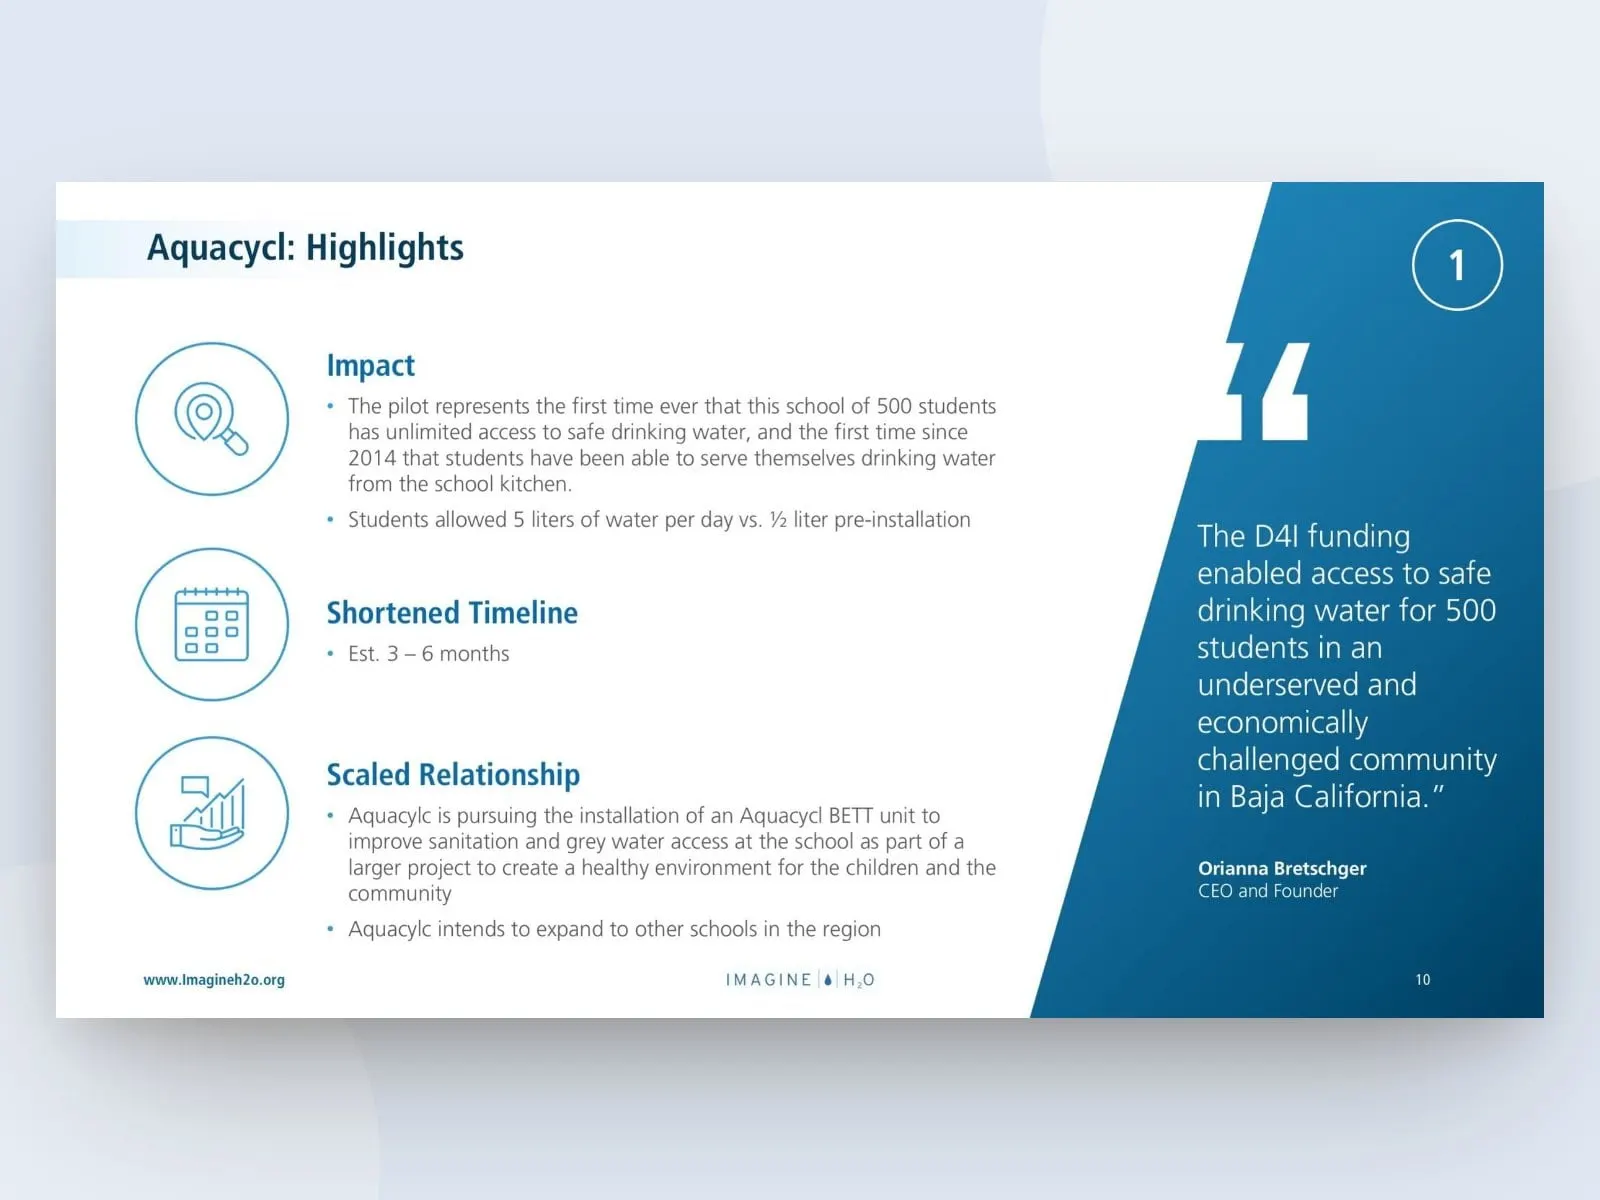
We have designed reports and plans for organizations like Imagine H2O and the Timiskaming First Nation strategic plan. Each started with the story the numbers needed to tell.
Non-profit or charity? See our work for non-profits. Data-heavy? See infographics.
What we design.
Print, digital or both.
Let’s make this year’s report the best one yet.
How we design reports.
Story first, then the data that proves it.
-
01Plan
Content & Story
We review your content and data and find the story. An annual report is more than a pile of numbers; it’s a chance to show stakeholders what the year achieved and where you’re headed next.
By understanding your results, priorities and readers, we can pick out the key messages that should run through the whole report. That story becomes the framework for structuring the sections in the next step.
-
02Structure
Structure
We organize sections so the highlights lead. Readers should see the biggest achievements and headline figures quickly, before diving into detailed financials or program updates.
A clear structure helps board members, funders, investors and members find what matters to them without hunting. With the order and hierarchy agreed, we can design layouts that guide readers through your annual report from the first page to the last.
-
03Design
Design & Data
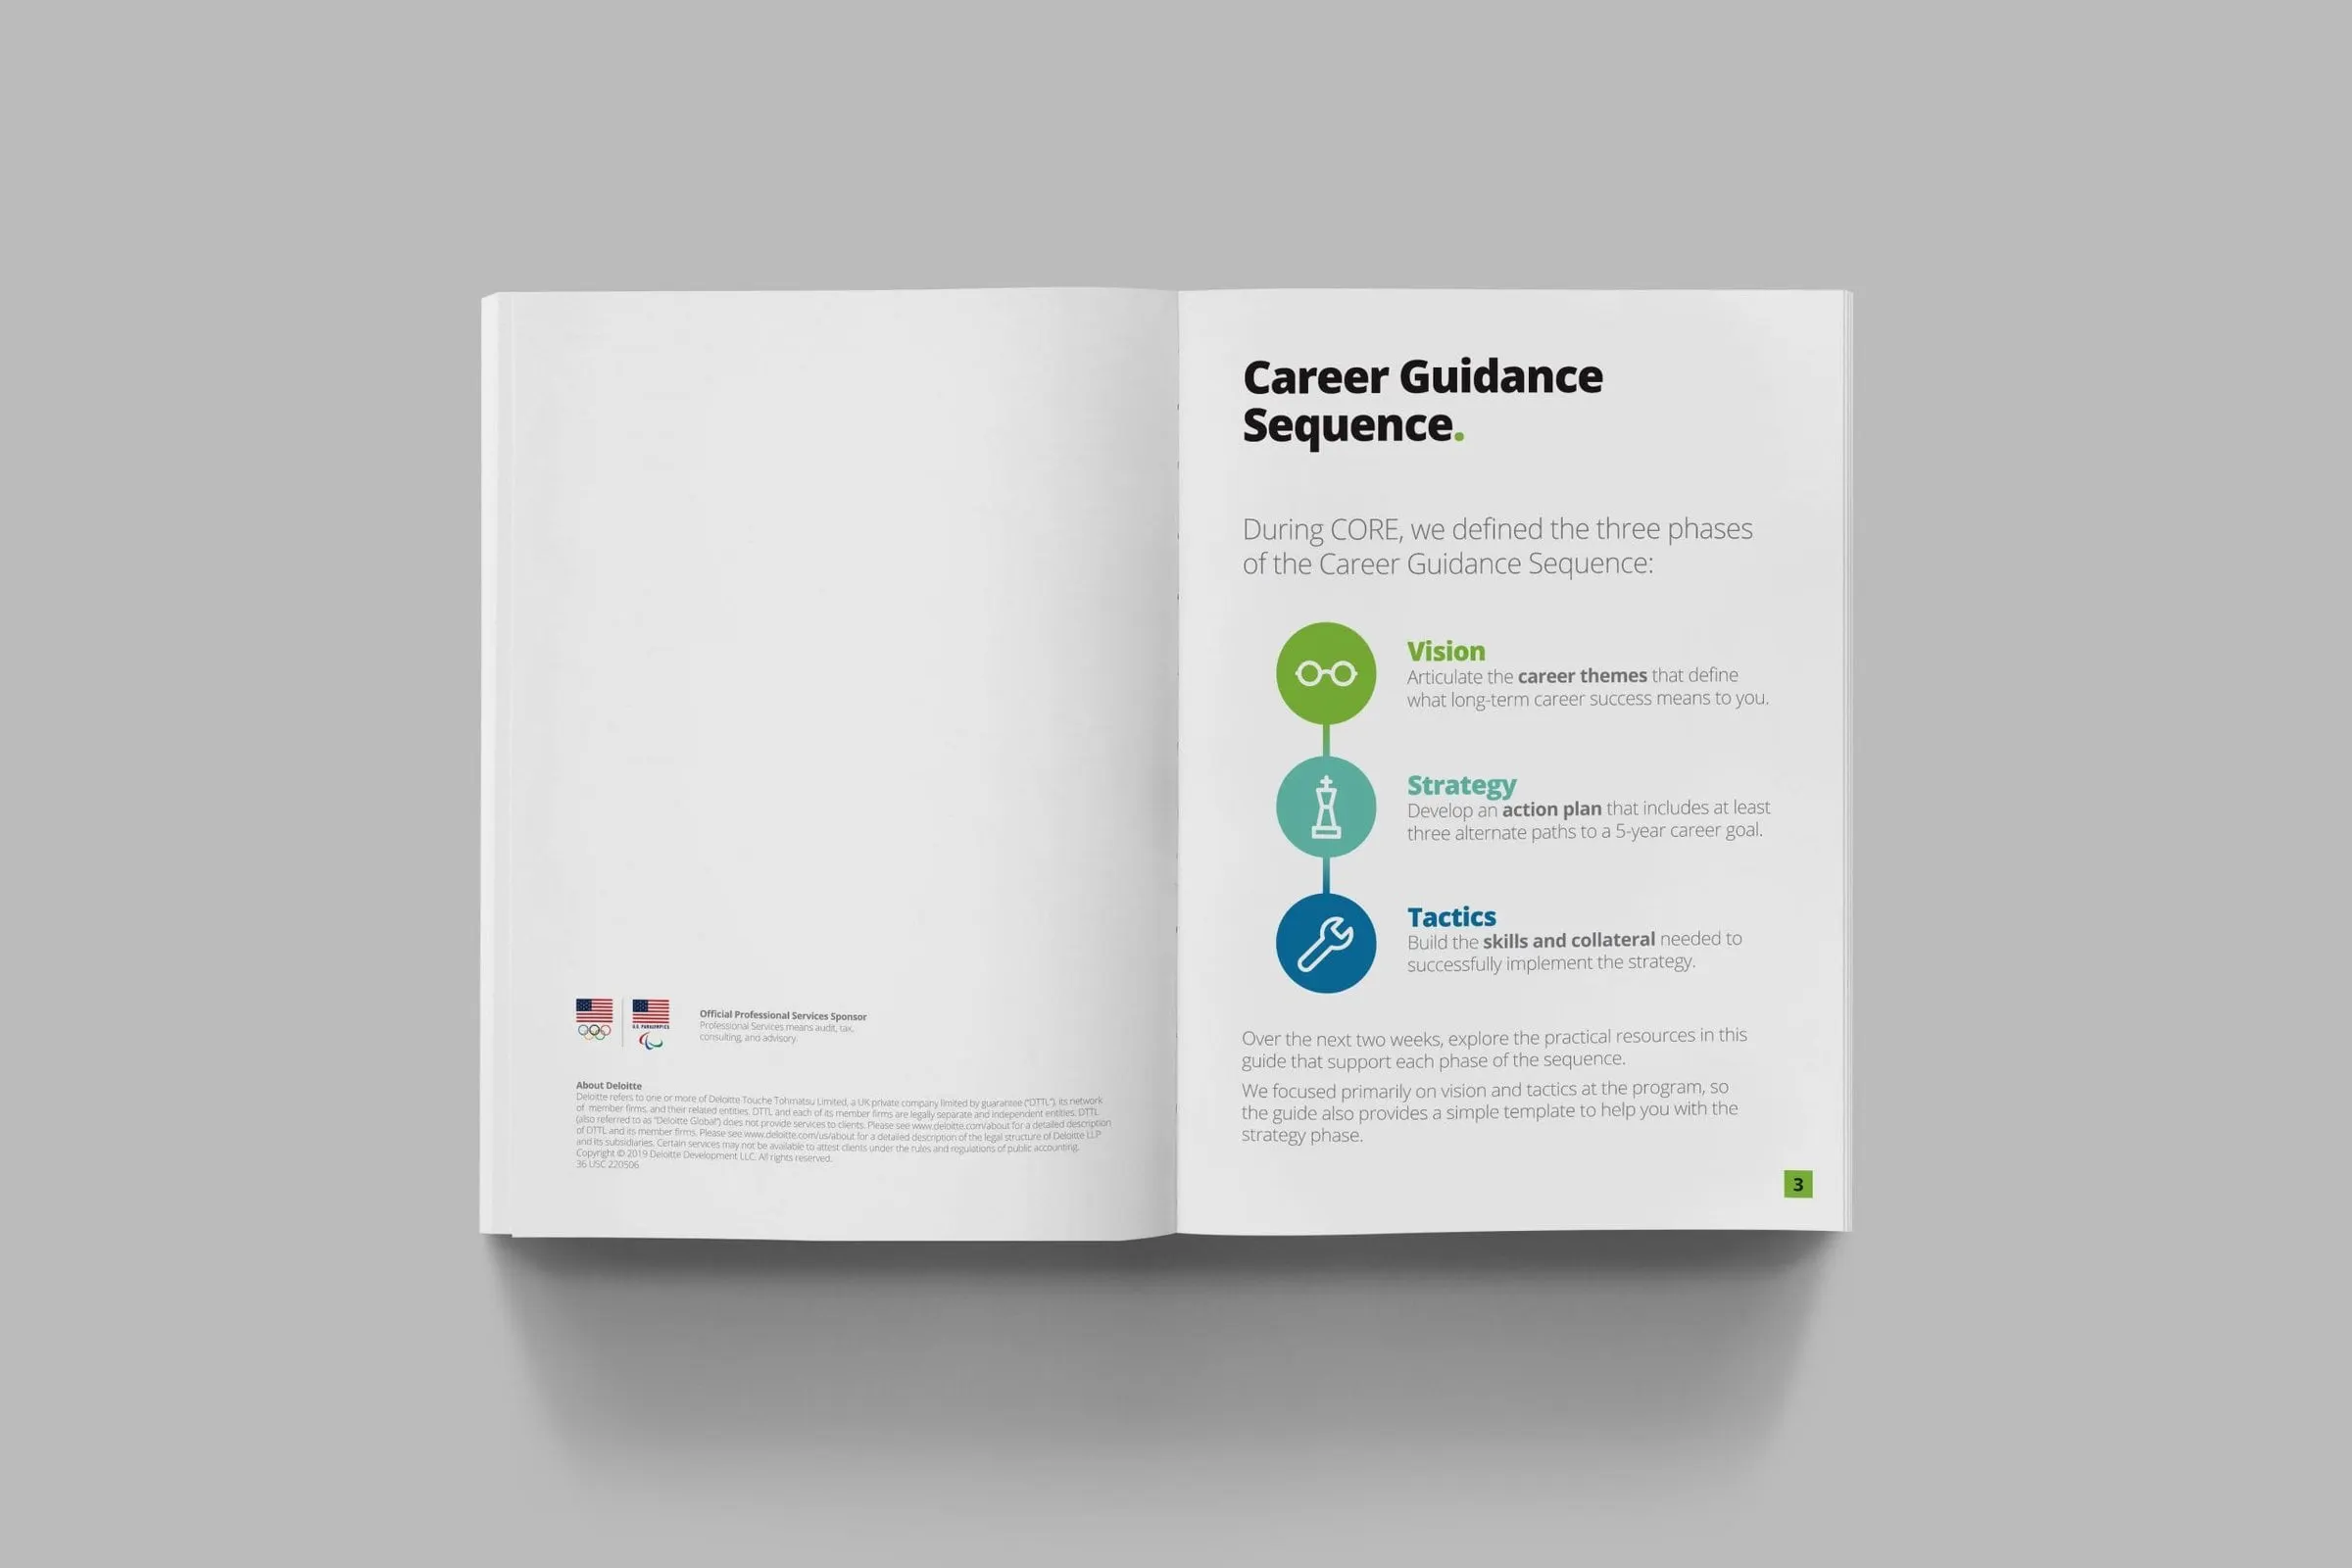
We design layouts, charts and infographics that turn your numbers and milestones into something people want to read. Data is presented so it’s easy to understand at a glance, without losing accuracy along the way.
Photography, typography and colour reflect your brand and give the report a confident, consistent feel. You review the design and data visuals with us, and we refine them together until the report is ready to share.
-
04Deliver
Print & Digital
Print-ready files and digital versions of your annual report. Print files are set up to your printer’s specifications, while digital versions are prepared for your website and email.
That means your report works whether stakeholders read it on paper around a meeting table or on a screen at their desk. You end up with a polished document that represents your organization well and keeps working all year long.
Reports people read.
A report that isn’t read can’t do its job. We turn your year’s numbers and milestones into a clear story your board, donors, investors and team will actually read, with highlights up front, honest charts and a design that feels like the rest of your brand.
Story-led
Highlights come first, with details where they belong. Readers get the big picture in a few pages, while anyone who wants the full numbers can find them easily further in.
Clear data
Charts are honest and easy to read. We choose the right chart for each figure and label it plainly, so results are understood at a glance and never misrepresented.
Reusable
Templates make next year easier. Your layouts, chart styles and page types are set up to be reused, which saves time and keeps reports consistent from one year to the next.
On brand
Your report looks like the rest of your brand. Whether it’s printed, a PDF or a web page, it reflects the same colours, type and tone as everything else you publish.
We’ve earned some good company. Recognize anyone?










Beyond their technical expertise, what truly stood out was how personally invested the team was in our success. They took the time to understand our business priorities and consistently aligned their work to meet those objectives.

We had an incredibly short and aggressive timeline that Envy Design Co. met, delivering an incredible website. After the websites were launched, leads continued to come in.

Their communication, attention to detail, and commitment to measurable outcomes made them feel like genuine partners rather than just a vendor. They are terrific.

Ready to build something worth envying?
Tell us a bit about your goals and we’ll be in touch as soon as we’re able to explore how we can help bring your vision to life.
Frequently asked questions.
What’s included in annual report design?
Structure and content planning, layout design, charts and infographics, photography direction and print-ready and digital files.
Annual report design starts with the story. Before layout begins, we work with you to organize content into a clear structure, so readers can follow your year's progress and find what matters to them. Then we design a layout system that keeps a long document readable and on brand. Financial data and key results become charts and infographics that are easy to understand at a glance. Photography direction helps your images feel consistent. You receive print-ready files and a digital version suited to your website and email.
Can you design an impact report for our non-profit?
Yes. We design impact reports that help donors and funders see what their support made possible.
A good non-profit impact report balances numbers and stories. Donors want to know where their money went and what changed, so we design clear infographics for key results alongside real stories, quotes and photos that show the human side. We organize the content so readers can skim highlights or read in depth. The report should also feel consistent with your brand and easy to share, both in print and online. If you're preparing an impact report for a campaign, anniversary or annual meeting, we'll plan around your deadline.
Can you create a template we can reuse?
Yes. We can design the report as a reusable template for future years.
A reusable annual report template saves time and money in future years. We design a layout system with styles for headings, text, charts, tables and photos, then set it up so new content can drop in without rebuilding the document from scratch. Depending on your team, the template can be built in InDesign for designers or in tools like Word or PowerPoint for in-house staff. Next year's report keeps the same quality and consistency, and you can still refresh the cover or feature sections to keep it feeling new.
Do you help with writing?
We can edit and structure your content, and we always work to make the story clear.
Annual reports often come together from many contributors, which can leave the content repetitive, uneven or hard to follow. We review your material, suggest a logical structure, trim where things repeat and edit for clarity and consistency. We'll also identify where data could be shown visually or where a short summary would help readers. Accuracy remains with your team, especially for financial and program information, so we'll flag anything that needs confirming. The goal is a report that's easy to read and tells your year's story well.
How much does annual report design cost?
It depends on page count, data and format. Every project is quoted individually.
An annual report design project might be a short, focused summary or a long report with detailed financials, many charts, photography and both print and interactive digital versions. Page count, the number of infographics, the state of your content and whether you need a reusable template all affect the scope. Printing is a separate cost. Tell us about your report, your audience and your deadline, and we'll send a clear quote. If you produce a report every year, a template can make future editions more efficient.
Related
Related services
Resources & articles
View all articles