Case study · Precision Biomonitoring
Precision Biomonitoring
A clean, infographic-led PowerPoint pitch deck for Precision Biomonitoring, the Guelph biotech behind on-site, real-time DNA testing.
01 — Context
Biotech pitch deck design for real-time DNA testing
Precision Biomonitoring (PBI) is a biotech company in Guelph, Ontario, building intelligent DNA solutions: field tests that return reliable results on-site, in real time, rather than after days or weeks in a lab. They came to us for biotech pitch deck design — a polished, on-brand PowerPoint that could carry their story in front of the people they needed to convince.
The content was already there, and it was dense. It covered public health statistics, a proprietary technology platform, a pipeline of new tests, a machine-learning product, revenue streams and a use-of-funds plan. Our job was to make all of it easy to take in, one idea per slide, so the room spends its attention on the opportunity instead of decoding charts.
The timeline was short, so we worked from PBI's existing logo and colours rather than inventing a new look. The blue, green and gold of the double-helix mark became the deck's entire palette.
02 — The problem, in numbers
One number per slide, full bleed
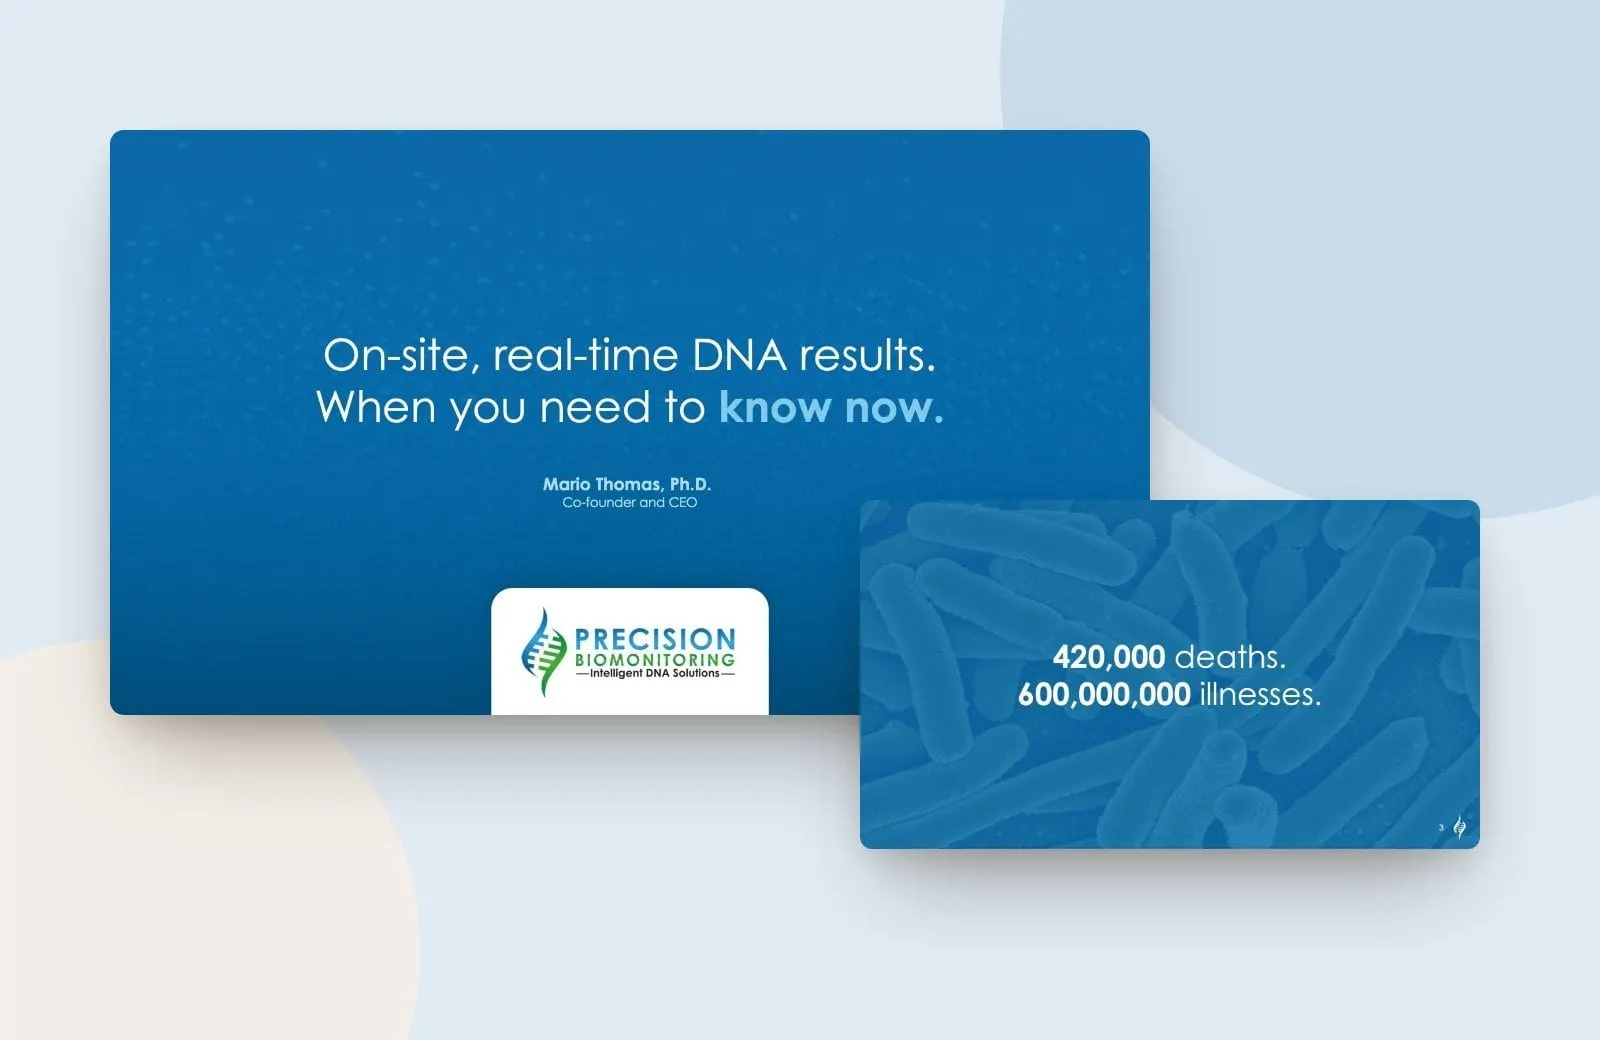
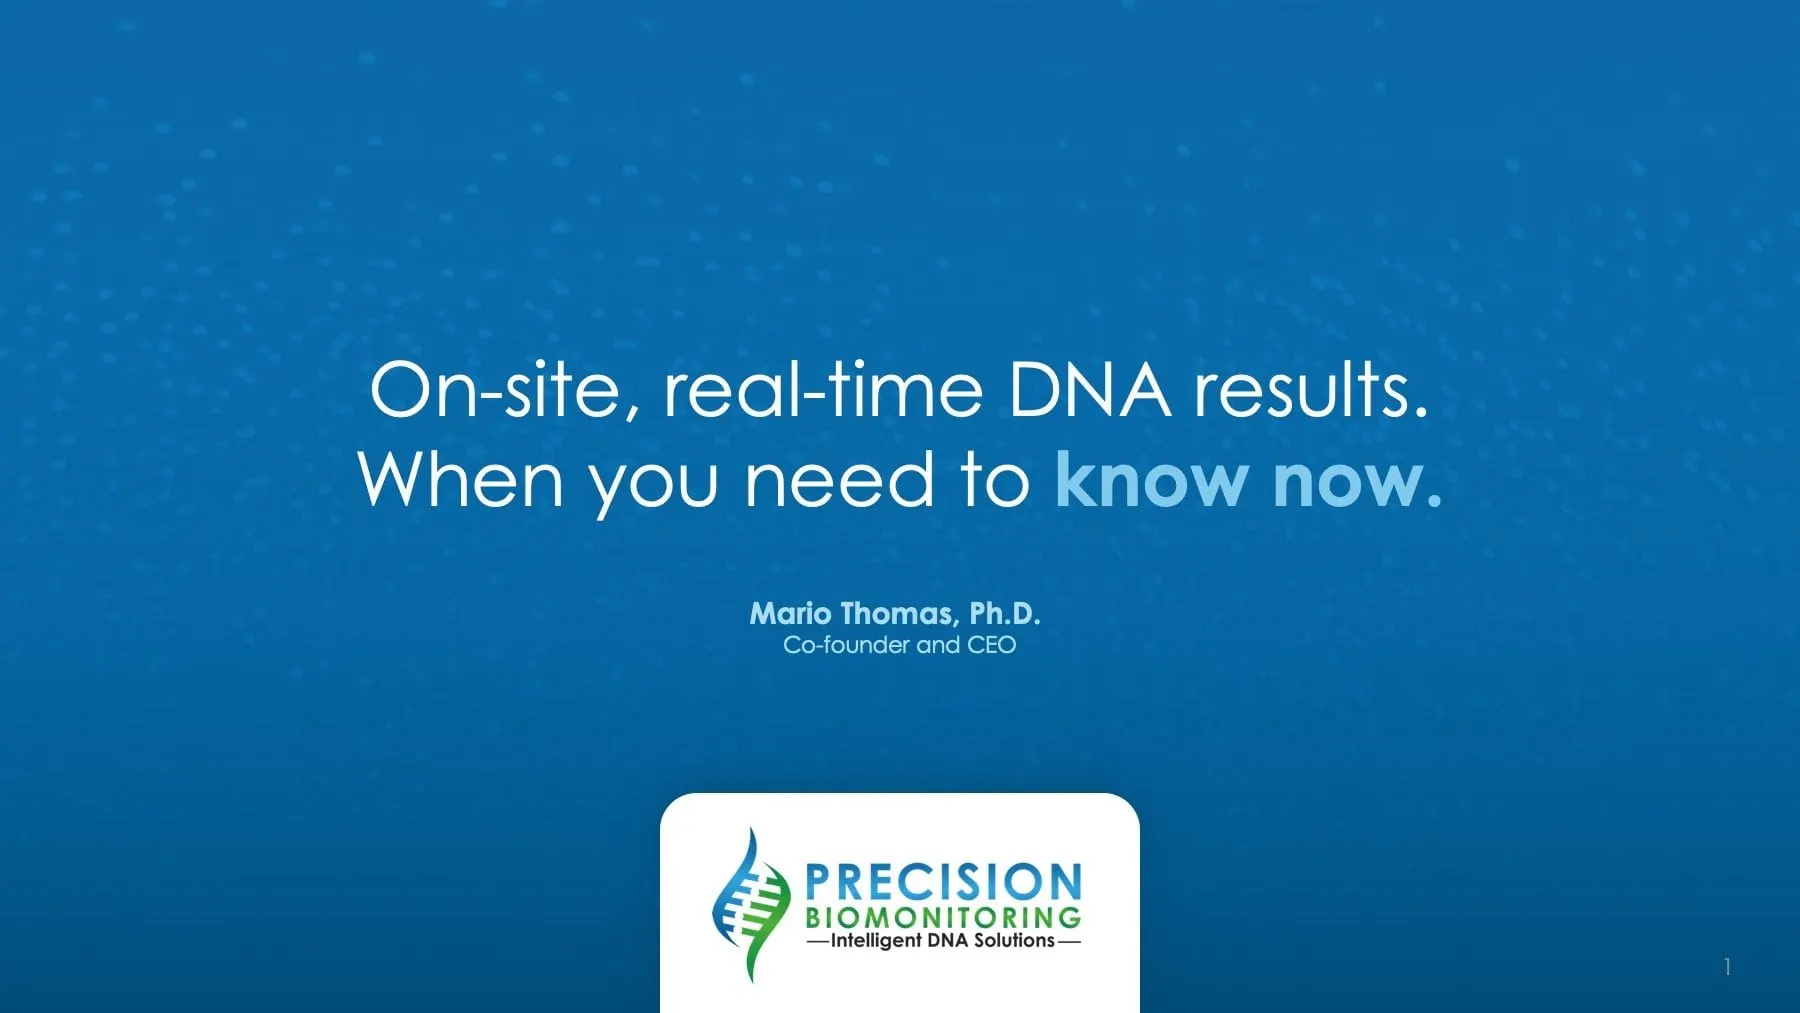
After a title slide that sets out the promise — "On-site, real-time DNA results. When you need to know now." — the deck spends its first minutes on why the problem matters. Every pathogen PBI can detect costs someone something, and we wanted each of those costs to land on its own.
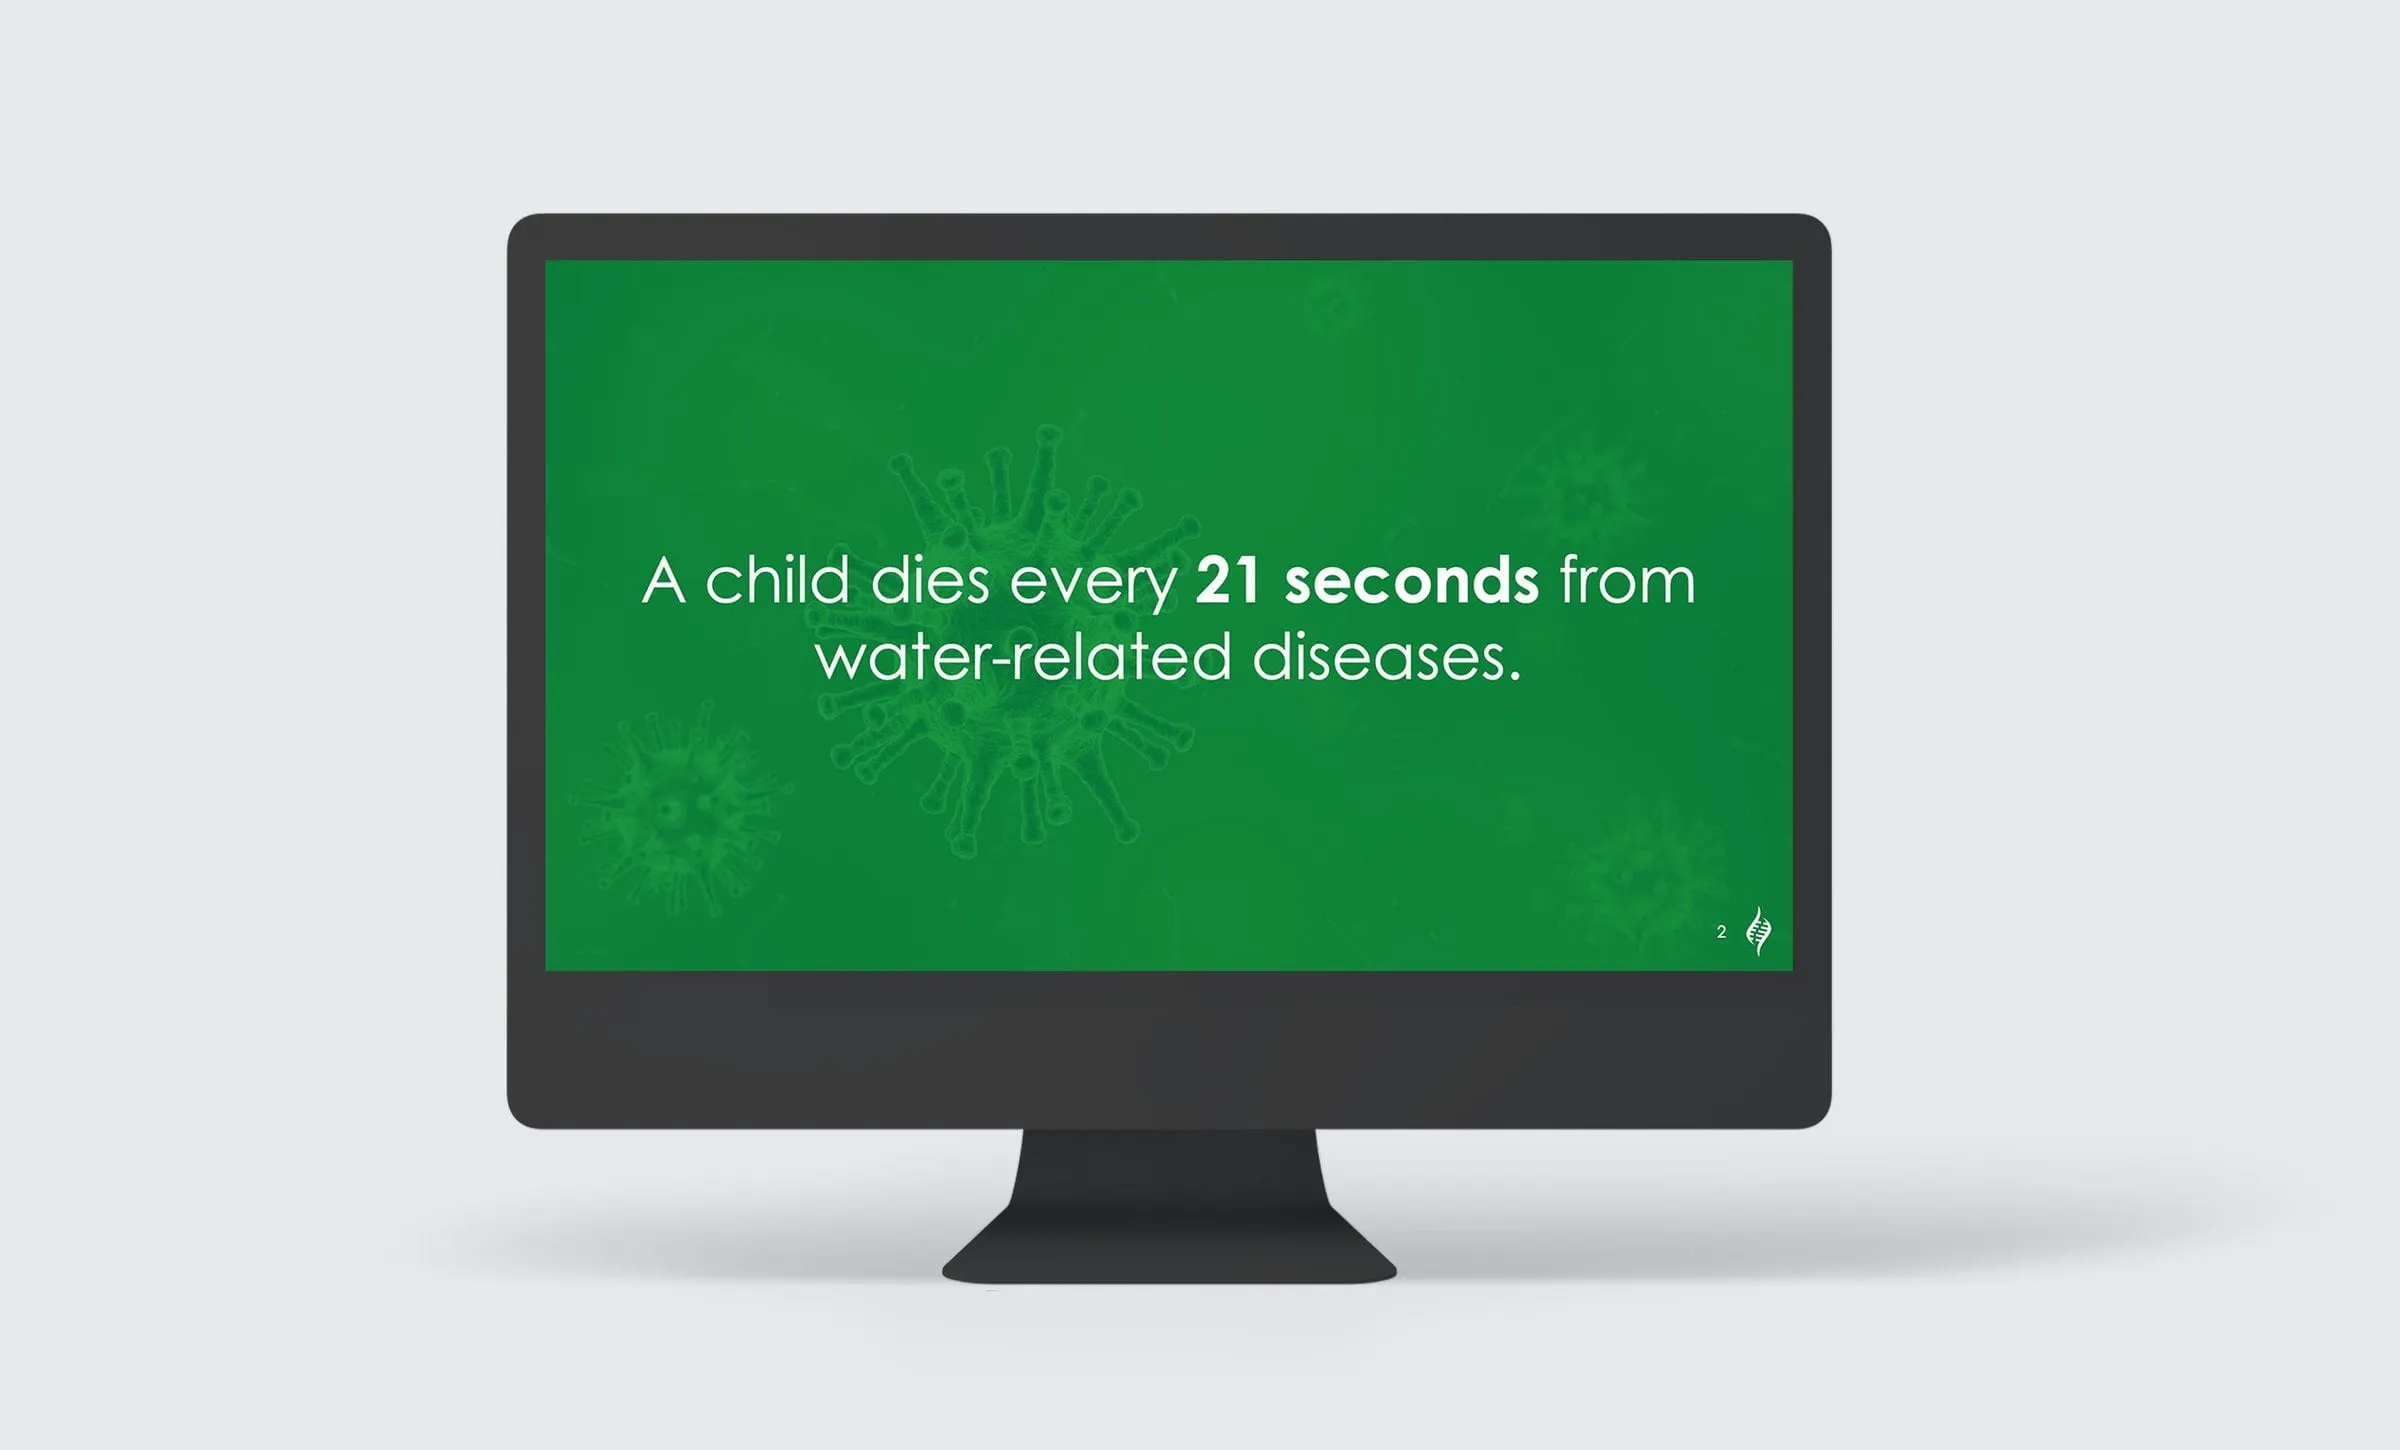
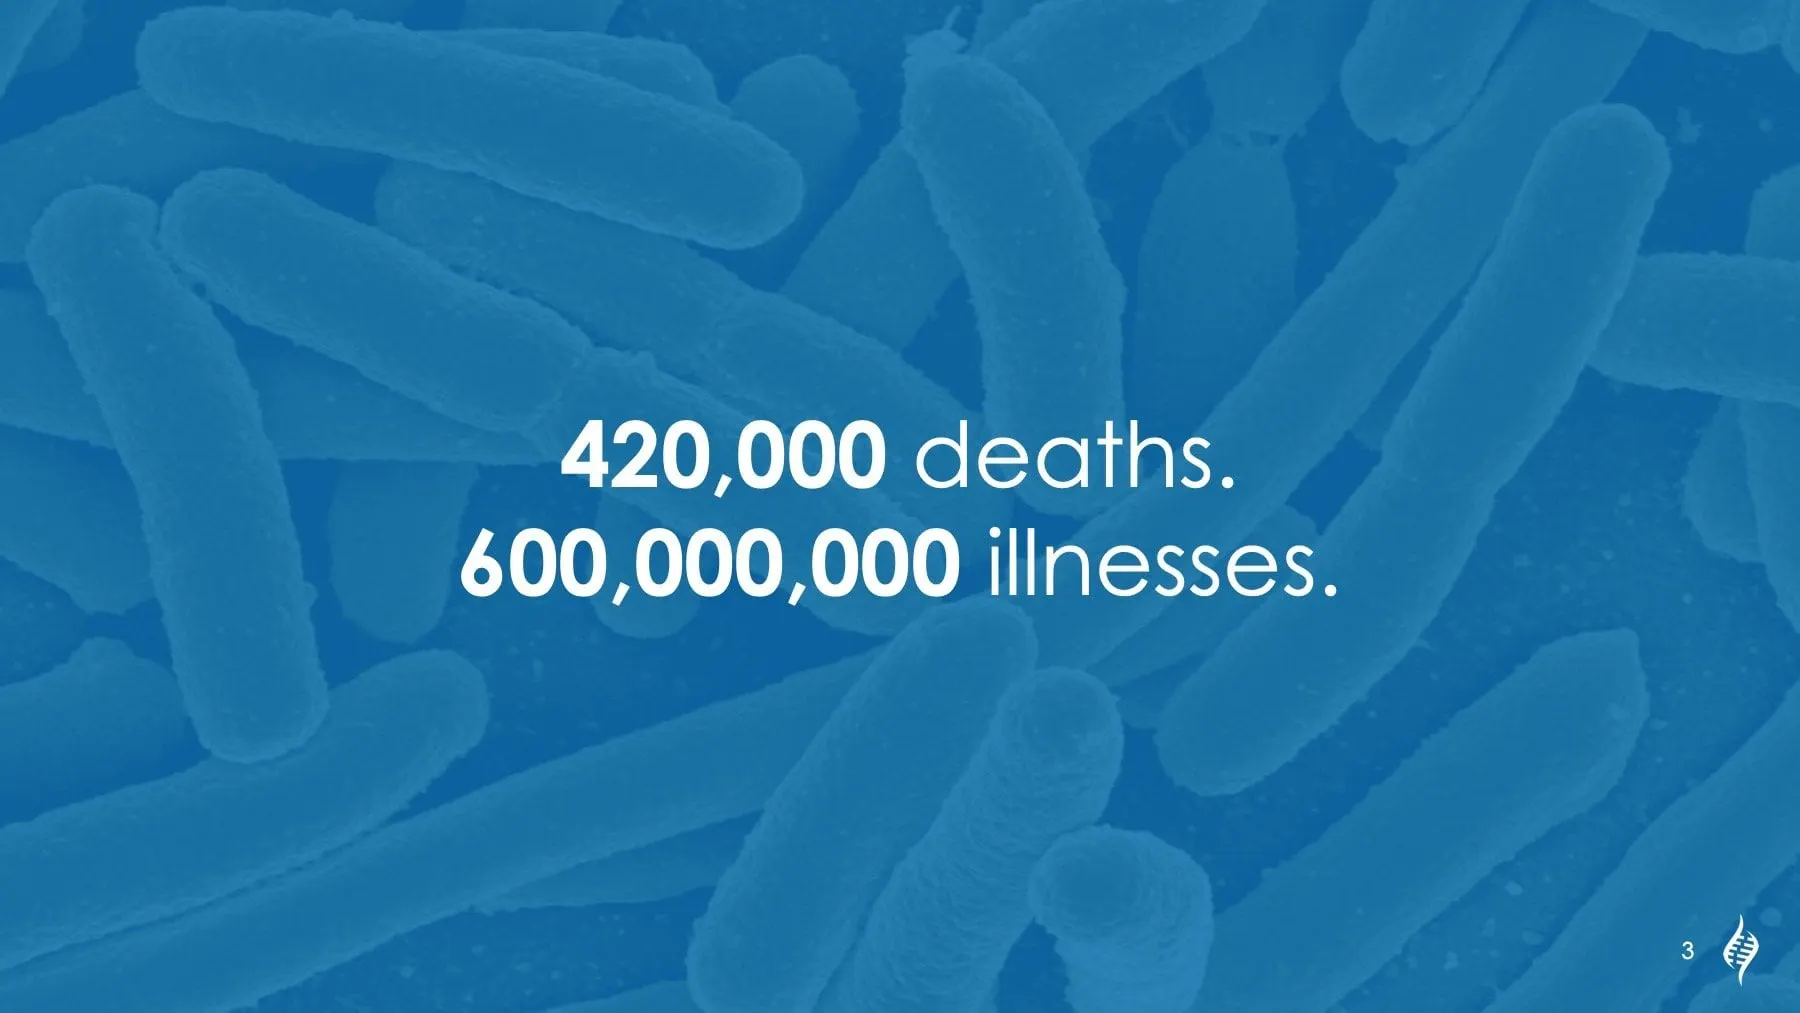
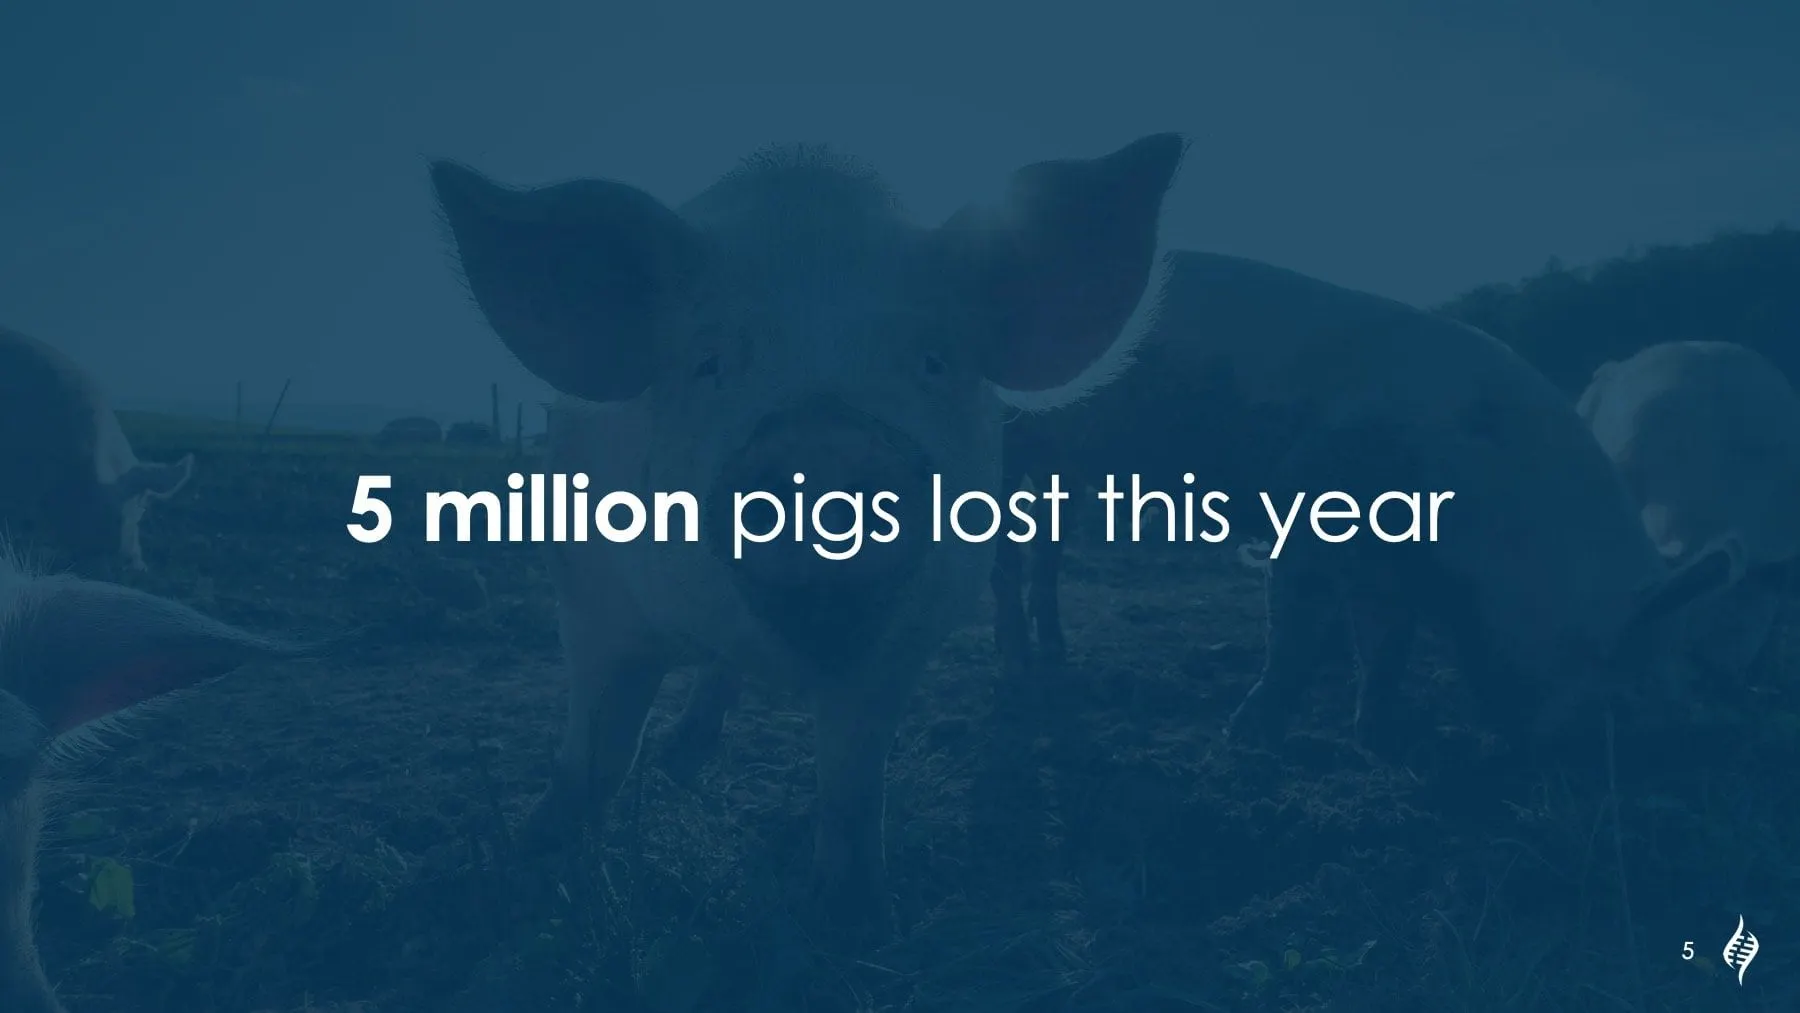
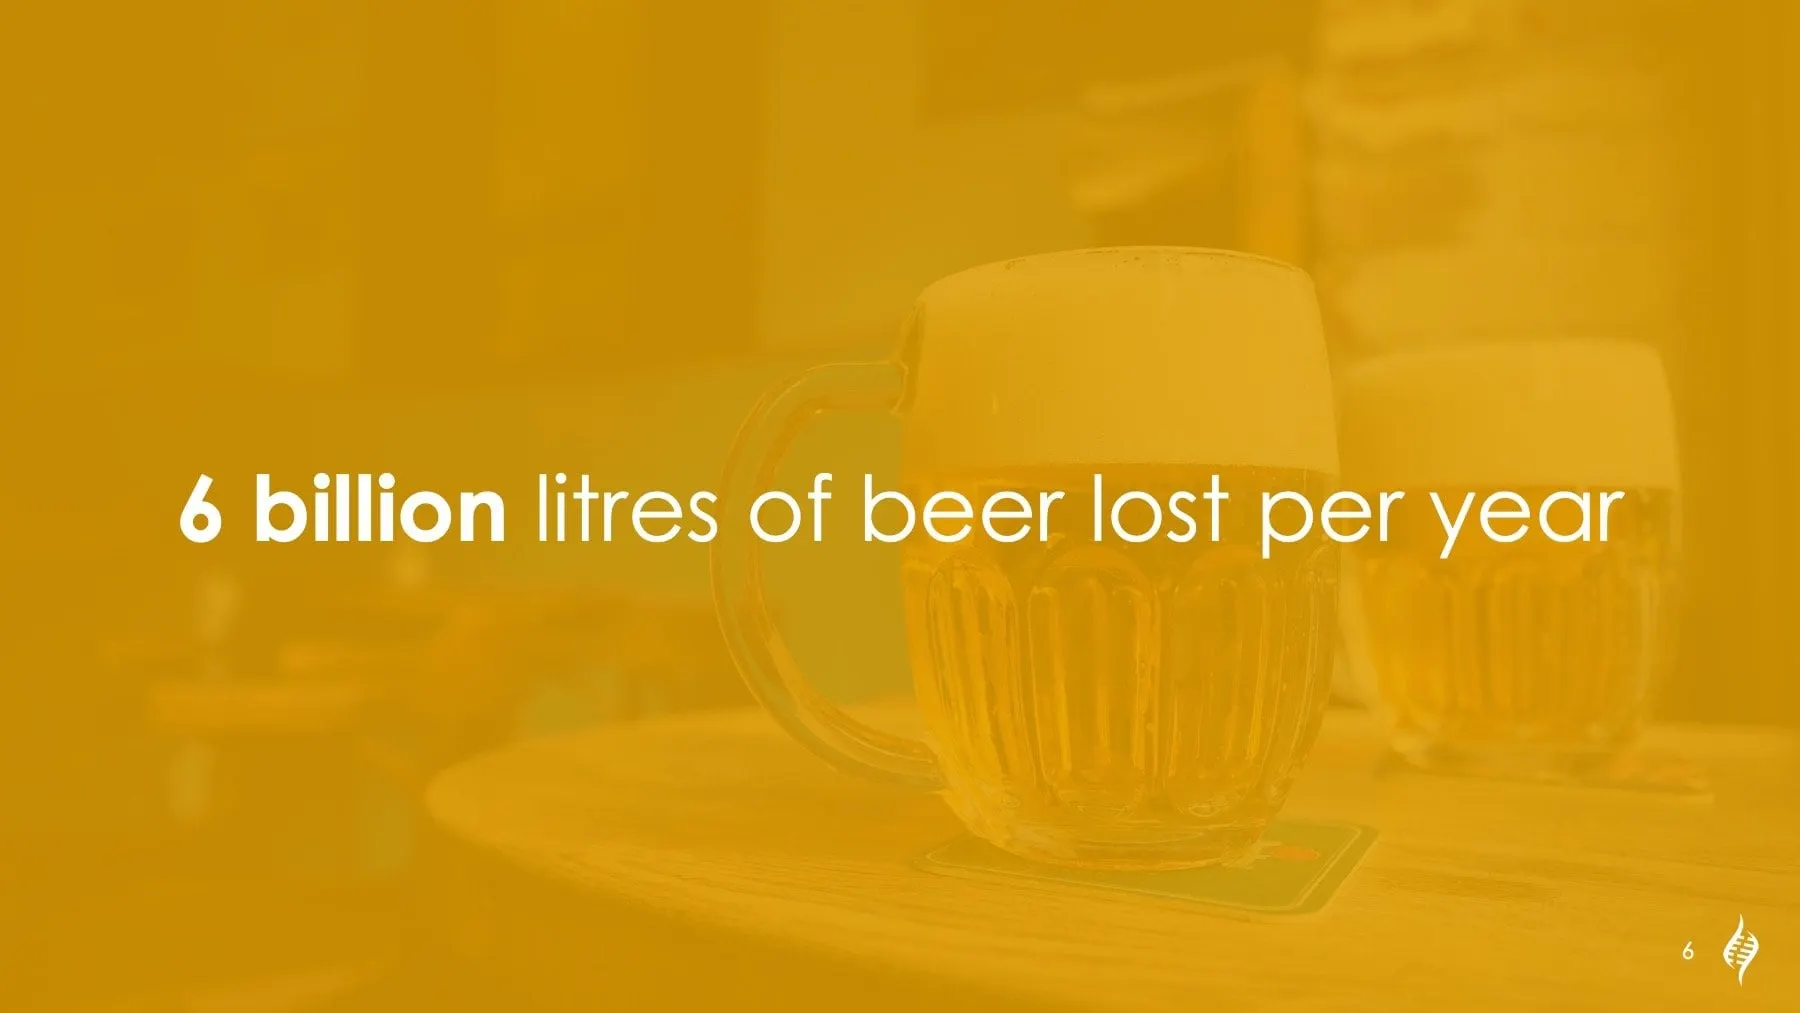
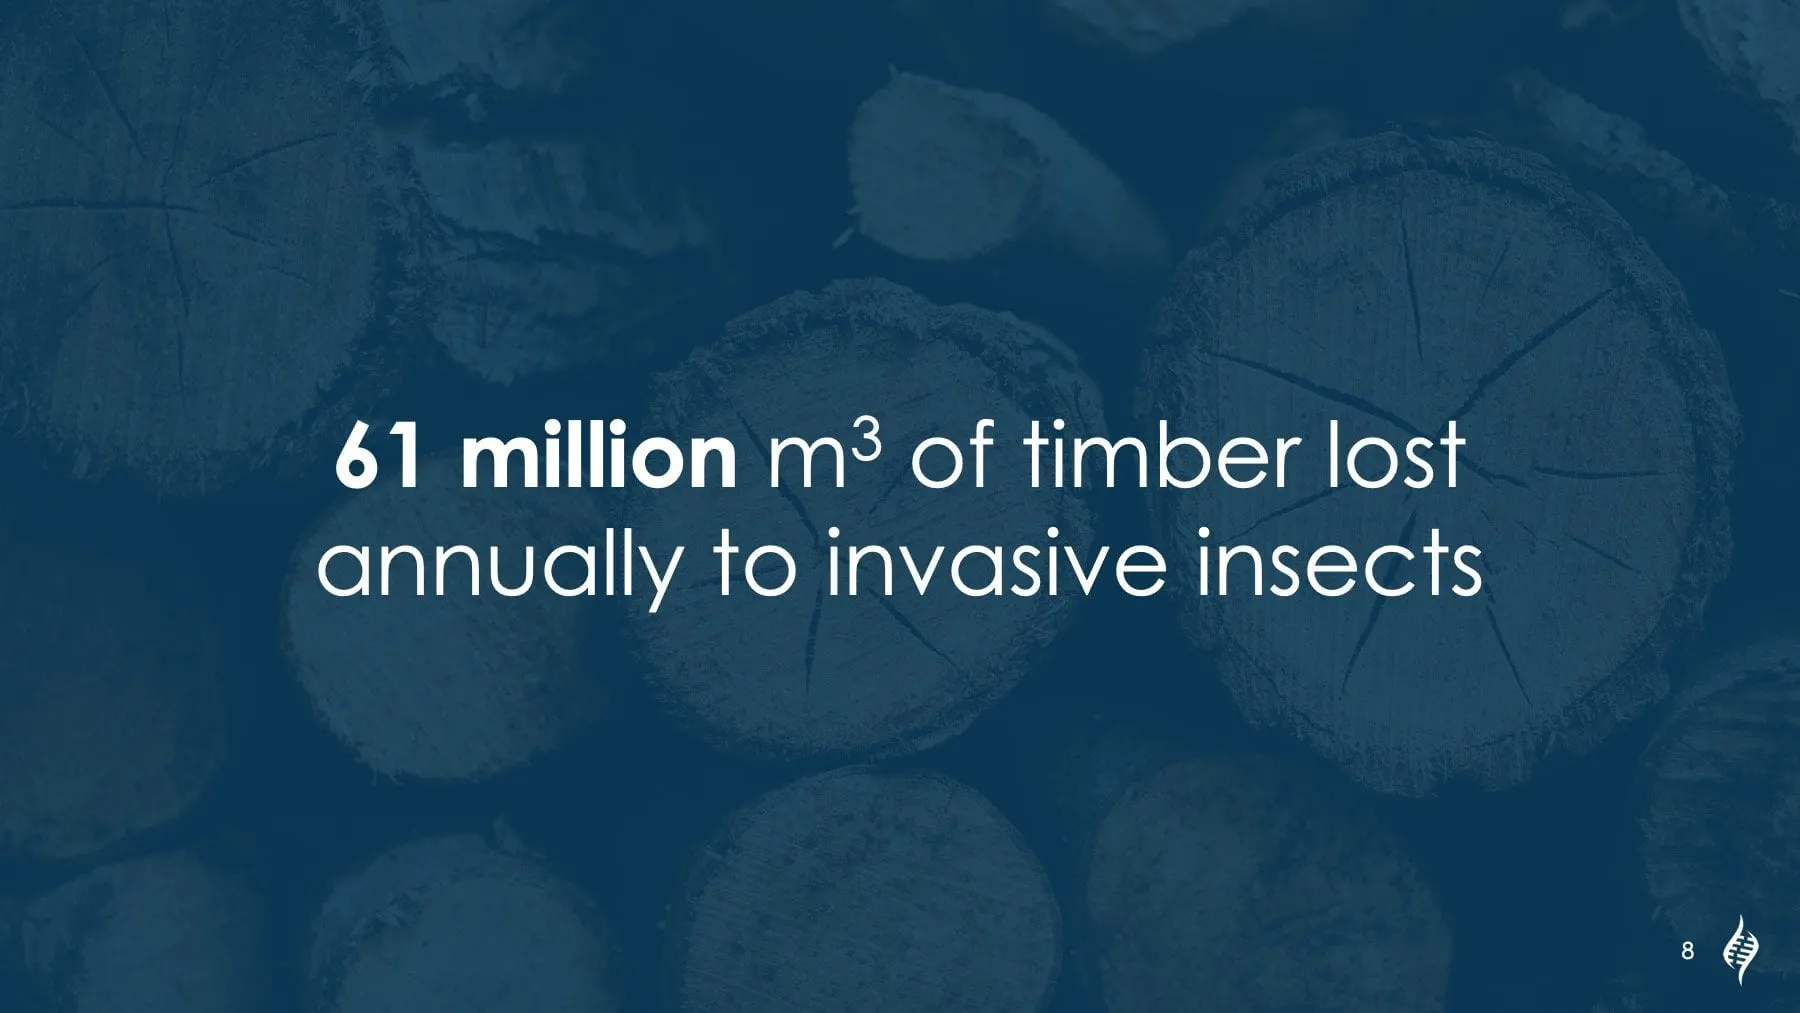
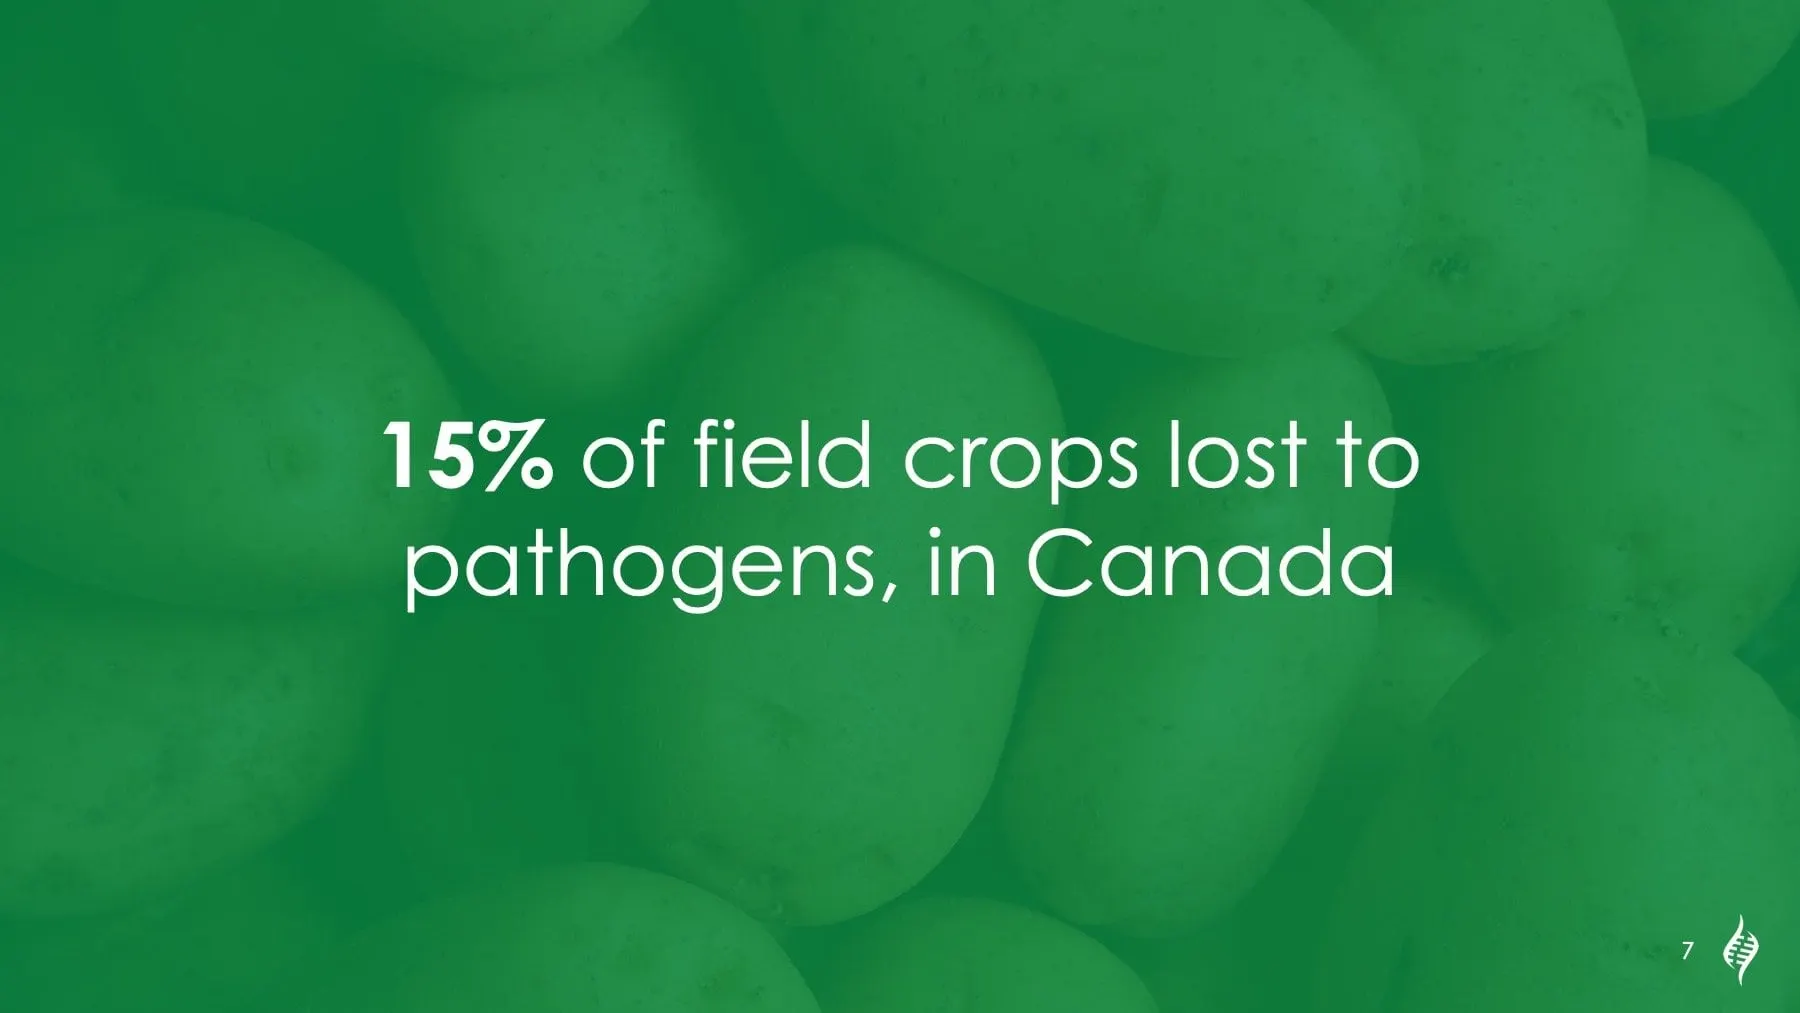
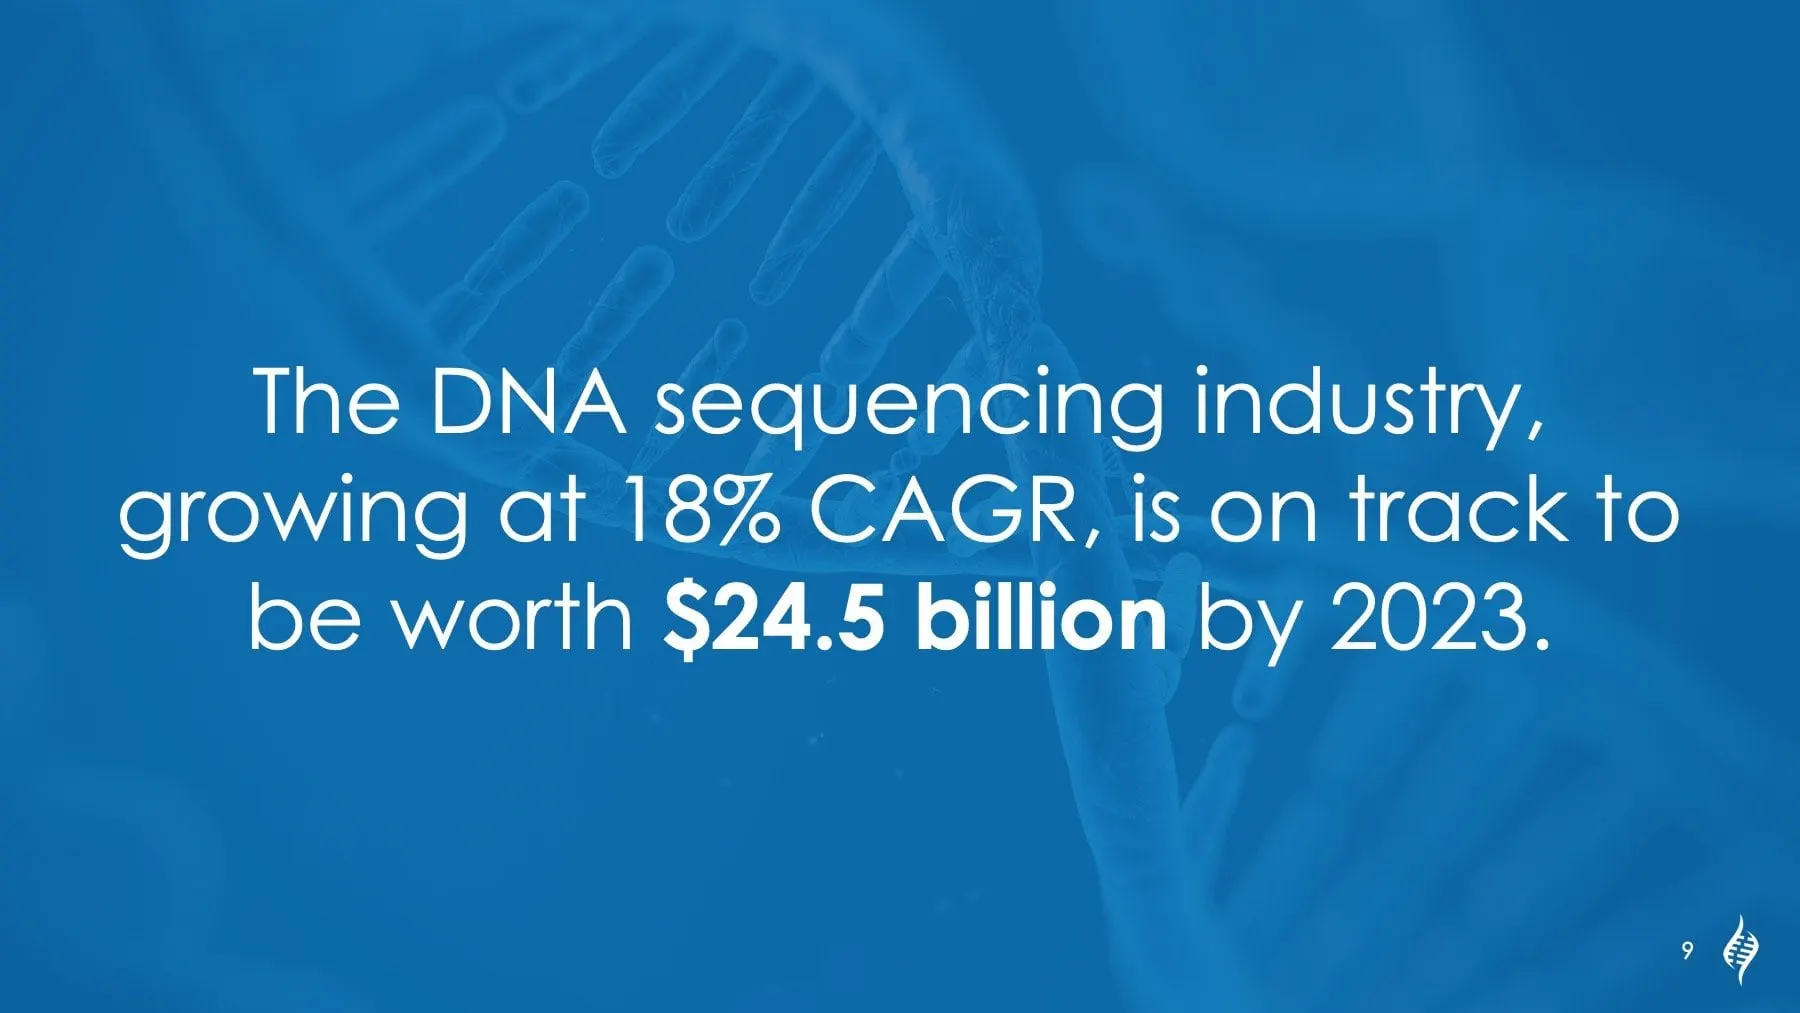
So each statistic gets a full-bleed photograph washed in a single brand colour, with the figure set in bold and the rest of the sentence in a light weight: 420,000 deaths and 600,000,000 illnesses over a magnified bacteria image, 5 million pigs over a farm field, 6 billion litres of beer over a pair of pint glasses, 61 million m³ of timber over cut logs.
The pattern does two jobs. It gives the presenter a natural rhythm — one beat, one fact — and it quietly shows how many sectors PBI serves, from water safety to agriculture, brewing and forestry, before the technology is even introduced. Rotating the colour from slide to slide keeps a run of similar layouts from blurring together.
03 — The technology
Turning TripleLock™ into a picture
The middle of the deck has the hardest job: explaining a proprietary platform to people who aren't molecular biologists. We leaned on infographic design instead of paragraphs.
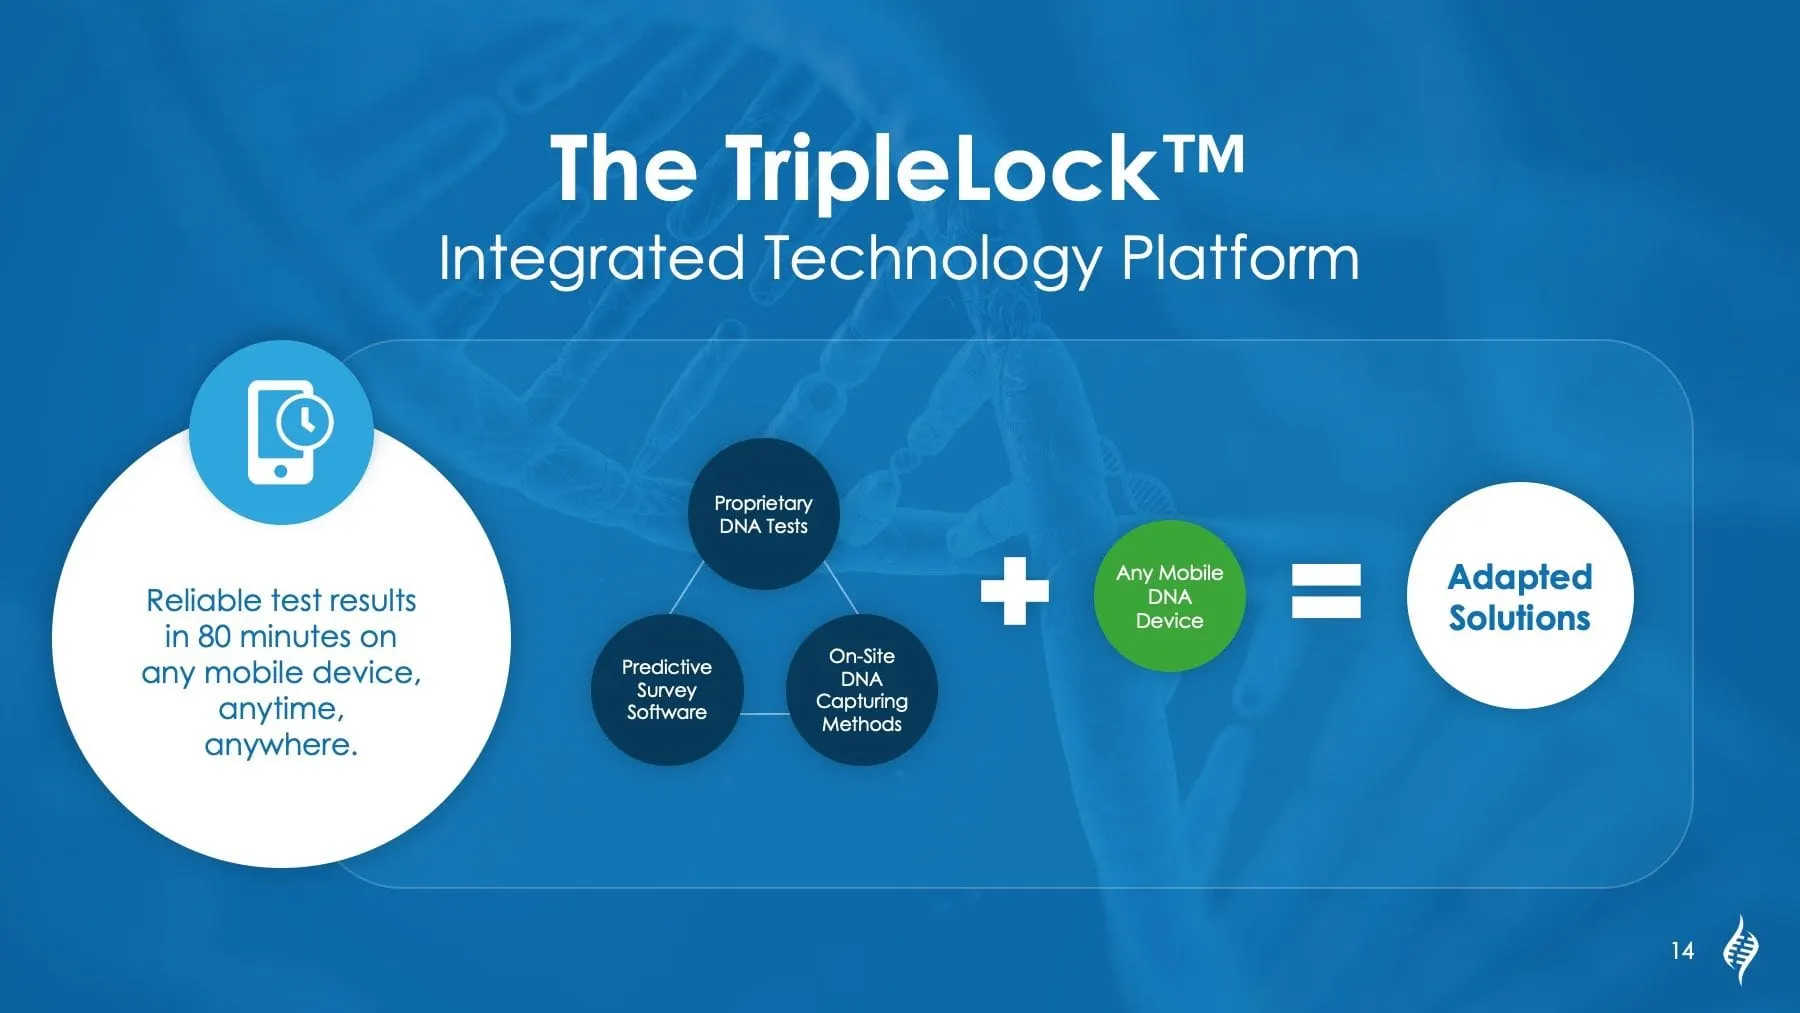
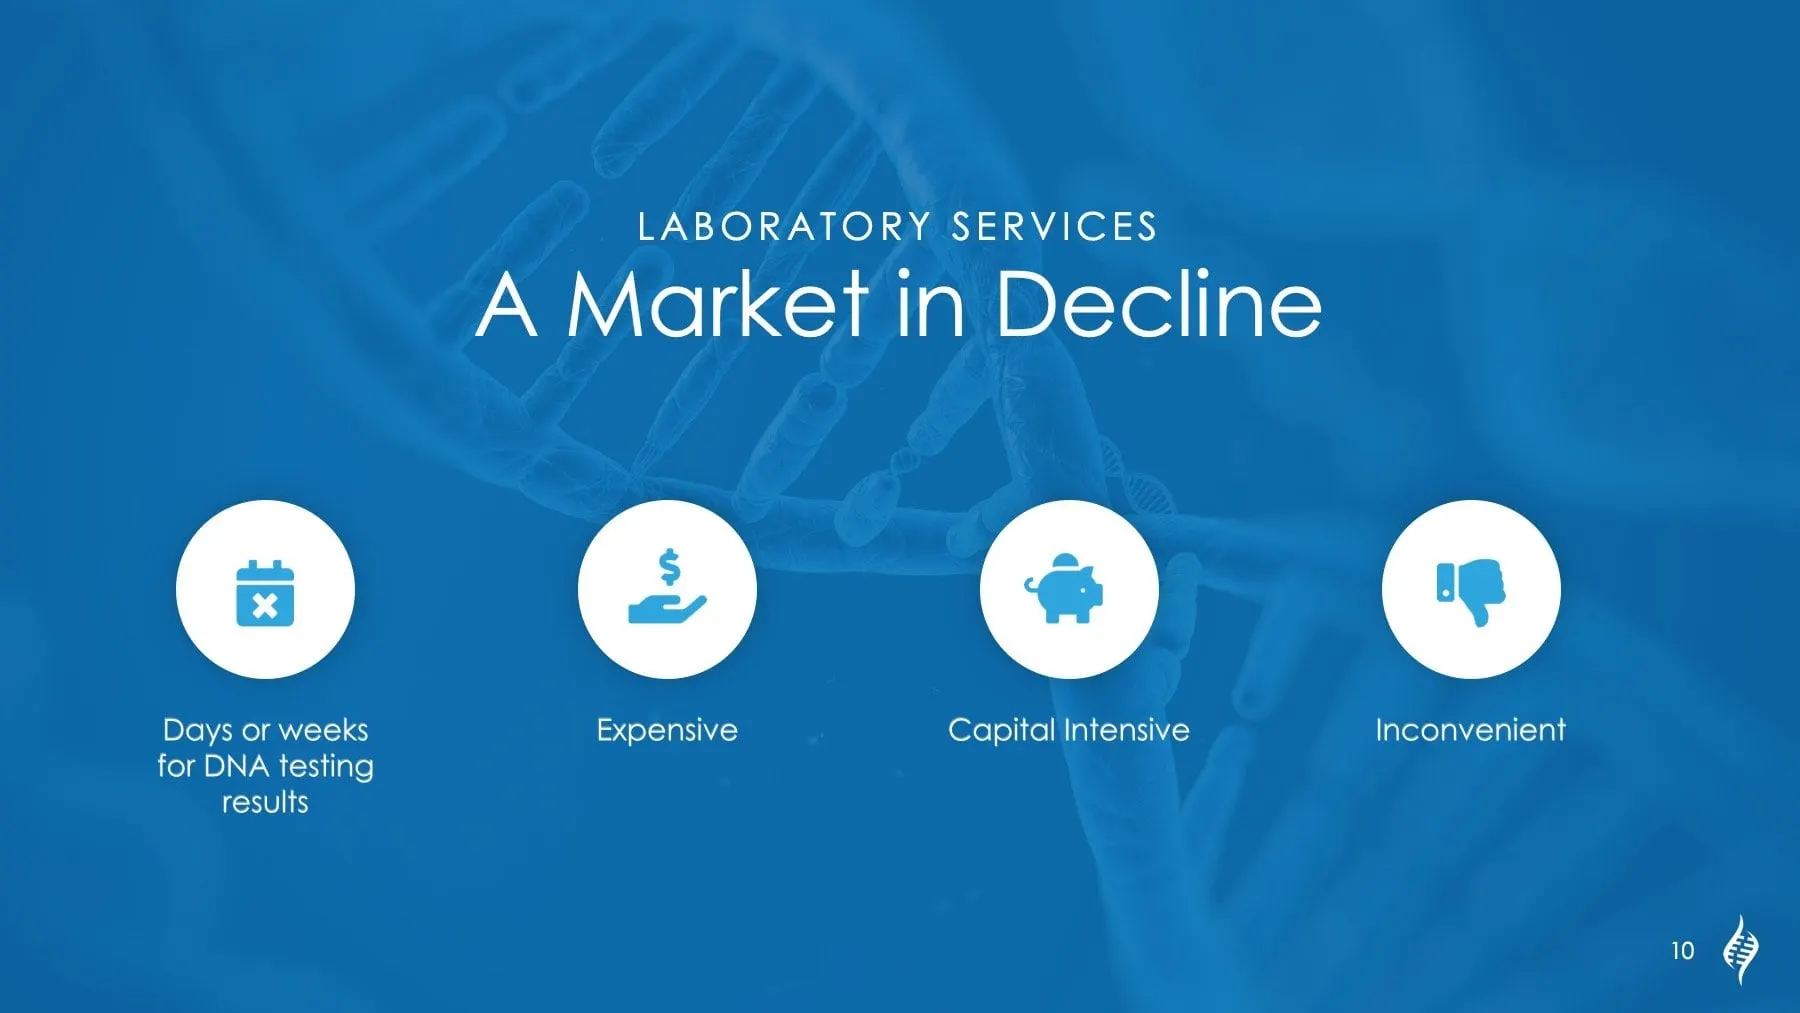
First, a slide frames the status quo. Under the heading "Laboratory Services: A Market in Decline", four white icon circles name the pain points — days or weeks for results, expensive, capital intensive, inconvenient. Then the TripleLock™ Integrated Technology Platform is drawn as an equation: three linked circles for proprietary DNA tests, on-site DNA capturing methods and predictive survey software, plus any mobile DNA device, equals adapted solutions. A large callout states the benefit in plain words: reliable test results in 80 minutes on any mobile device, anytime, anywhere.
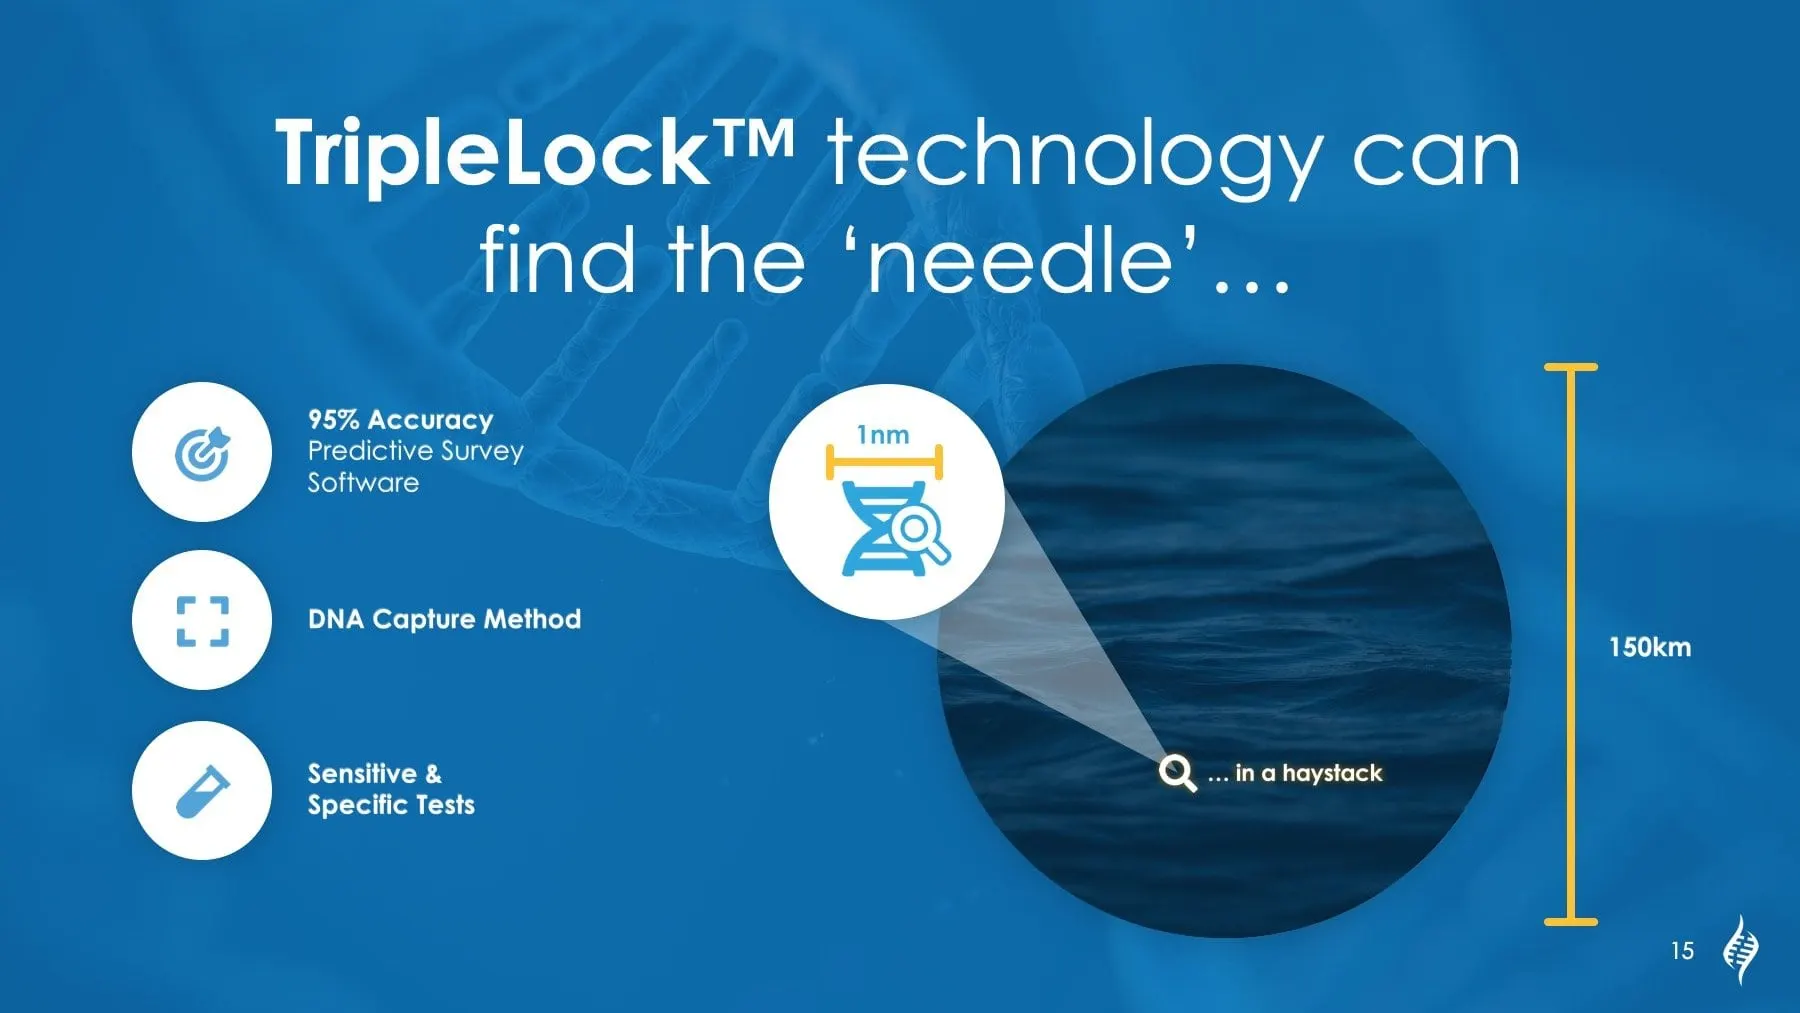
The follow-up slide borrows the deck's own metaphor — finding the needle in a haystack — and makes it literal with a magnified 1nm DNA icon against a 150km scale bar. It is the kind of image a listener remembers after the meeting. Getting the order of information right mattered as much as the illustrations; it is the same visual hierarchy thinking we bring to a homepage.
04 — The plan
Strategy slides that stay readable
The back half of a pitch deck is where most presentations fall apart: objectives, product roadmaps and financials crammed into bullet lists. We gave PBI a repeatable structure instead.
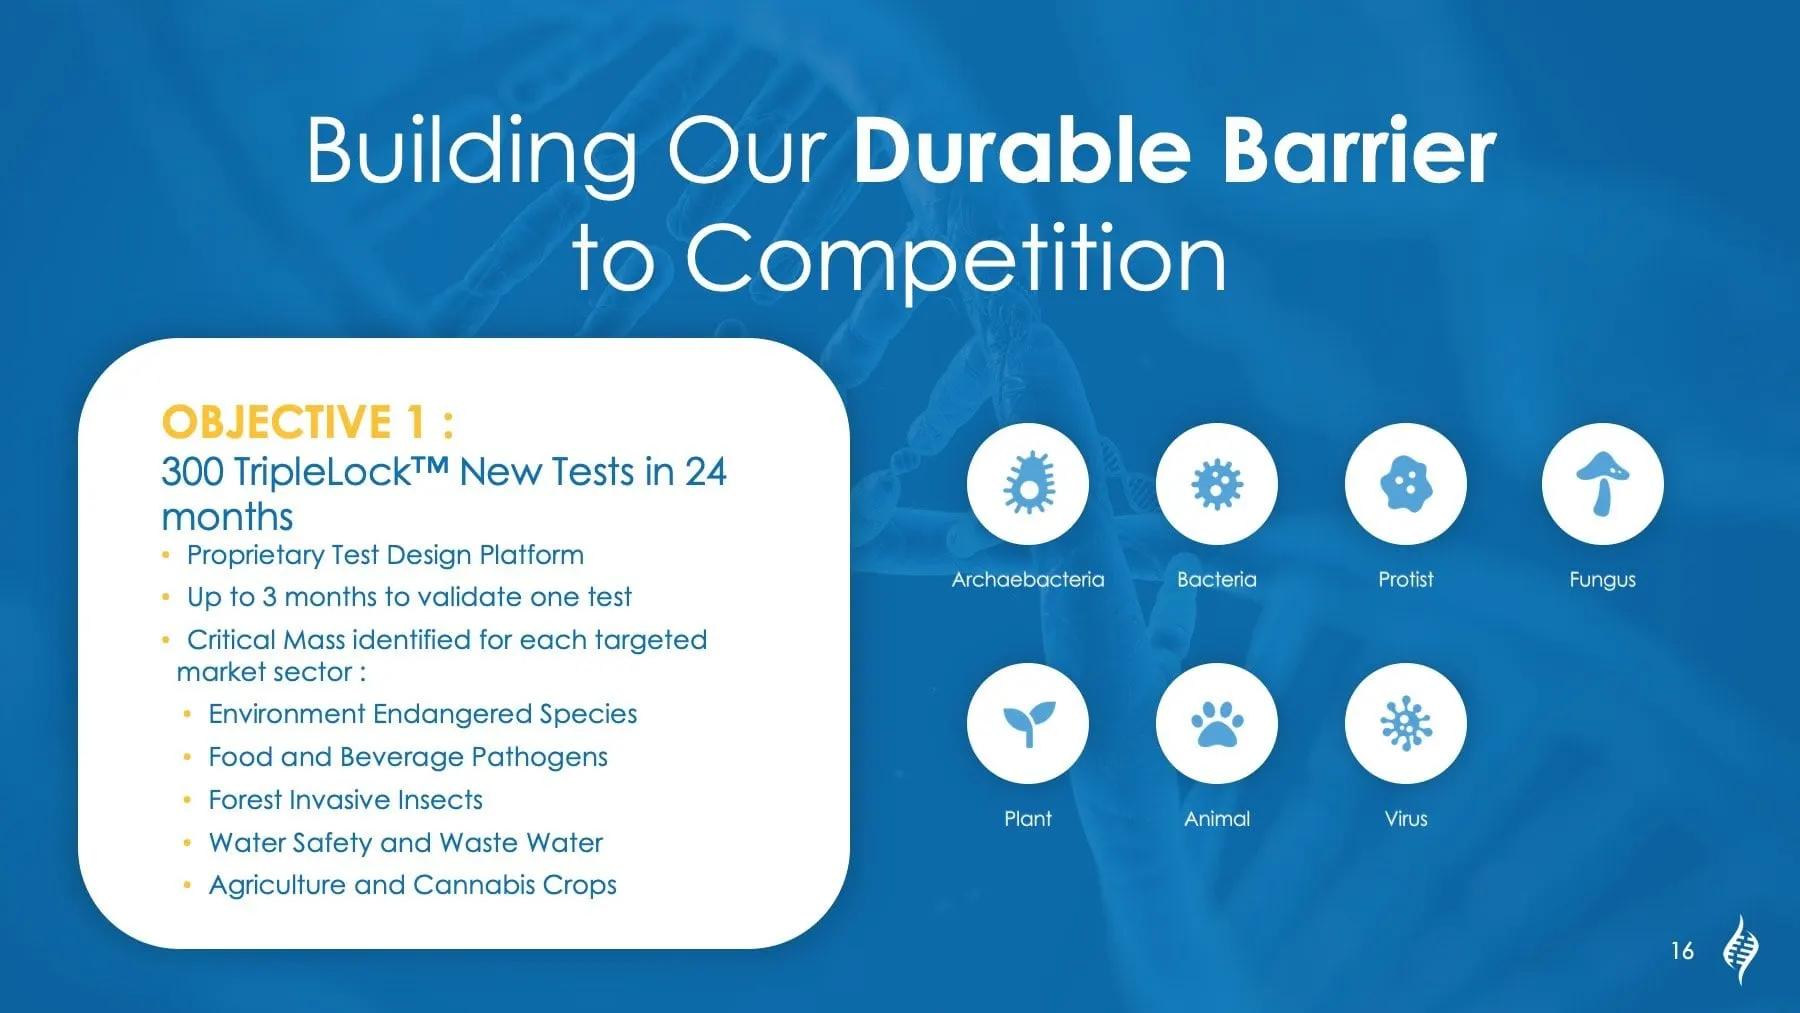
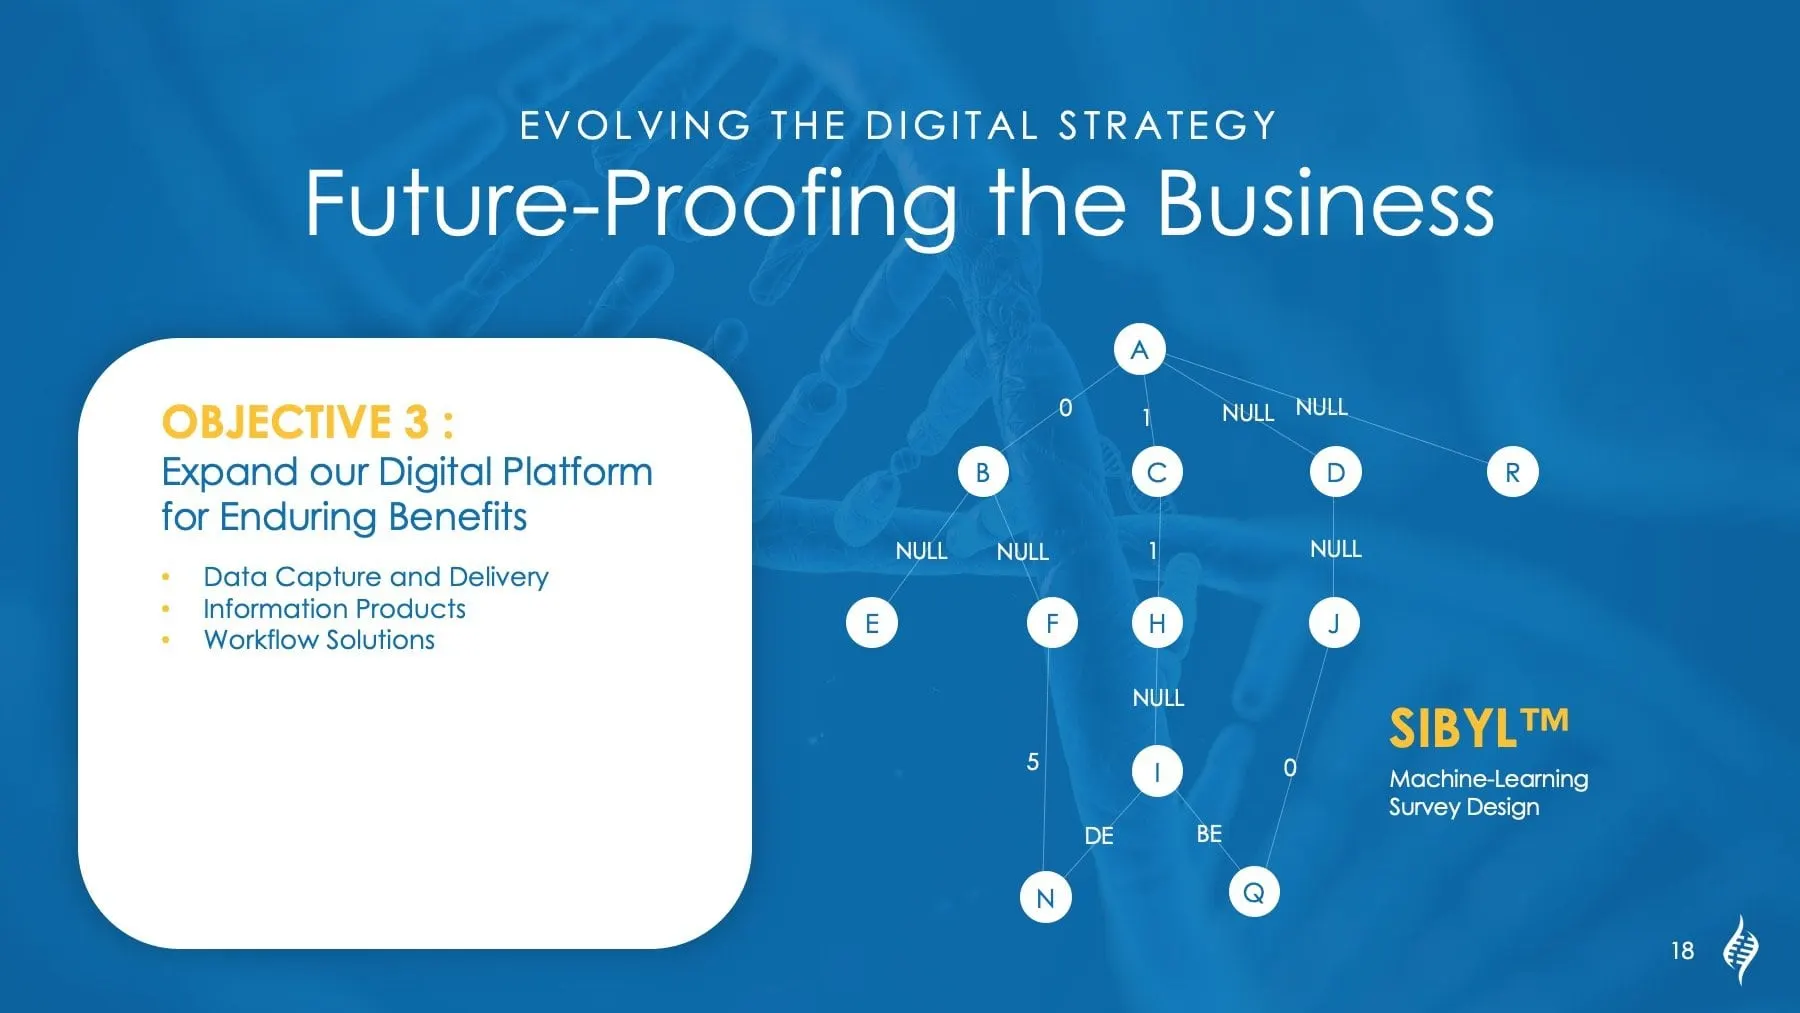
Each strategic objective sits in a white rounded panel on the left, with a gold "Objective" label and short bullets, while the right side carries the visual. For Objective 1 — 300 new TripleLock™ tests in 24 months — that is a grid of icons for the organisms the tests target, from archaebacteria and fungus to plants, animals and viruses. For the digital strategy, it is a node diagram introducing SIBYL™, PBI's machine-learning survey design tool.
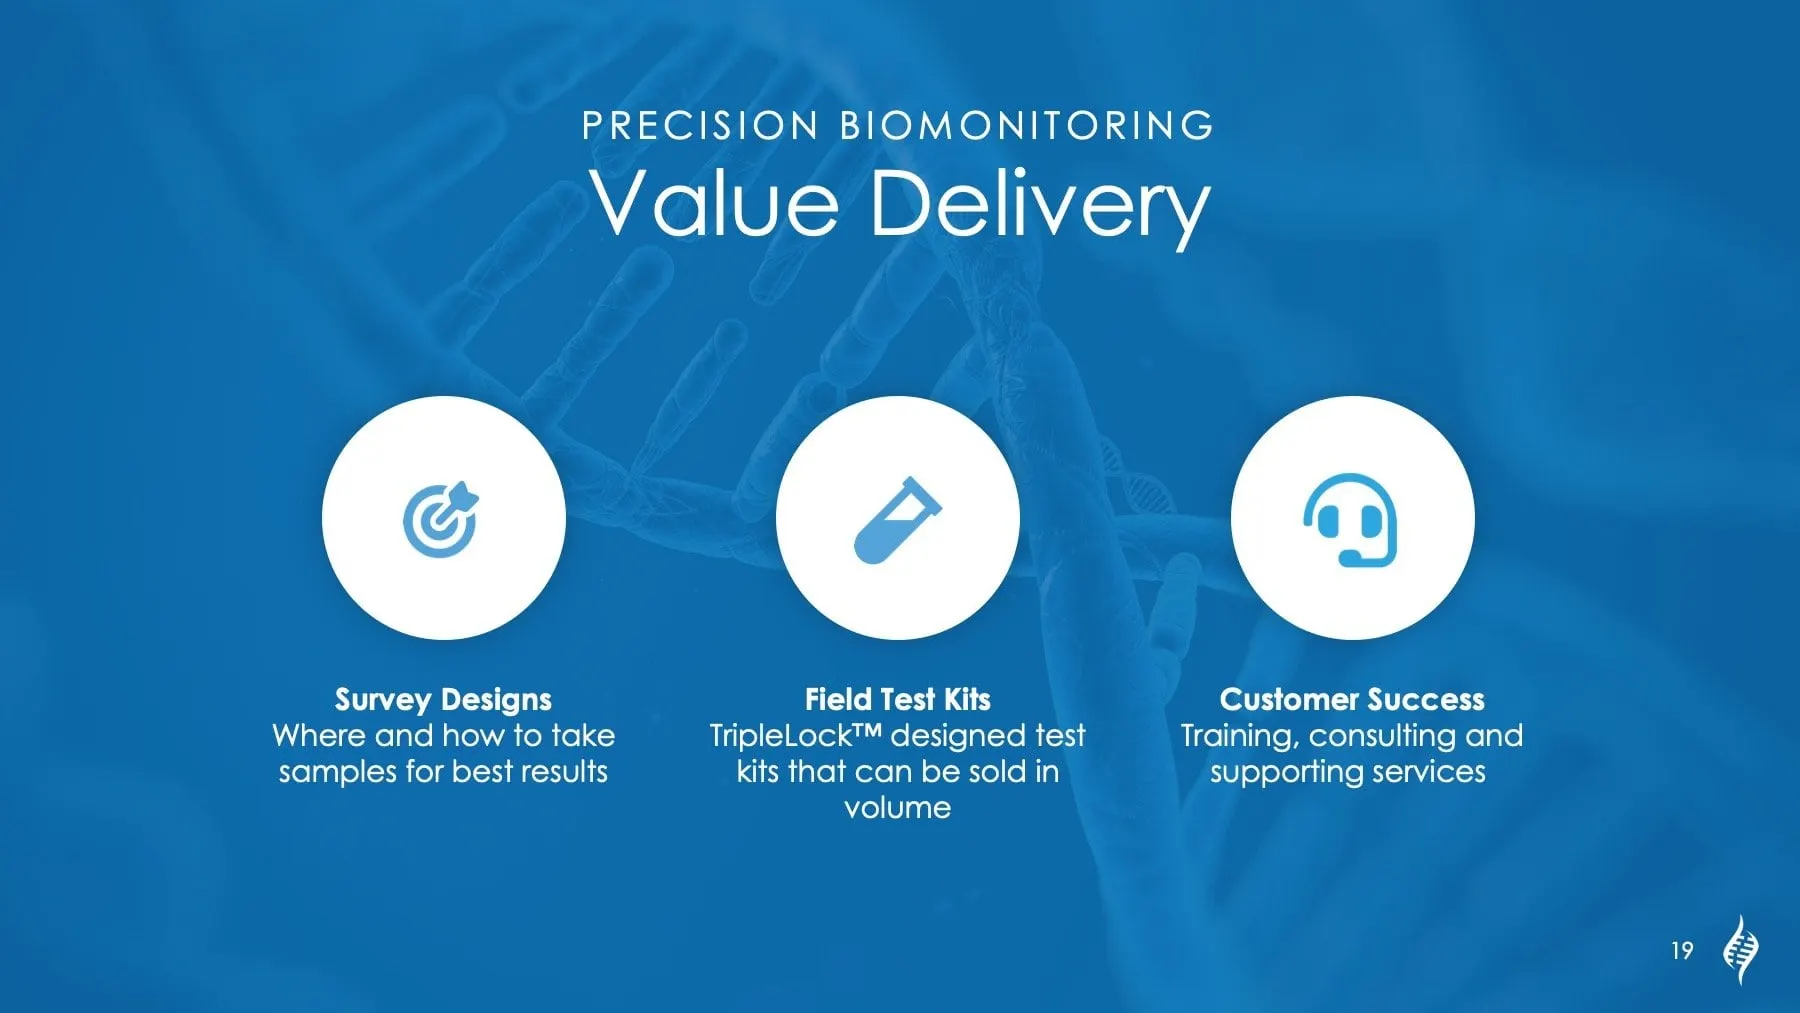
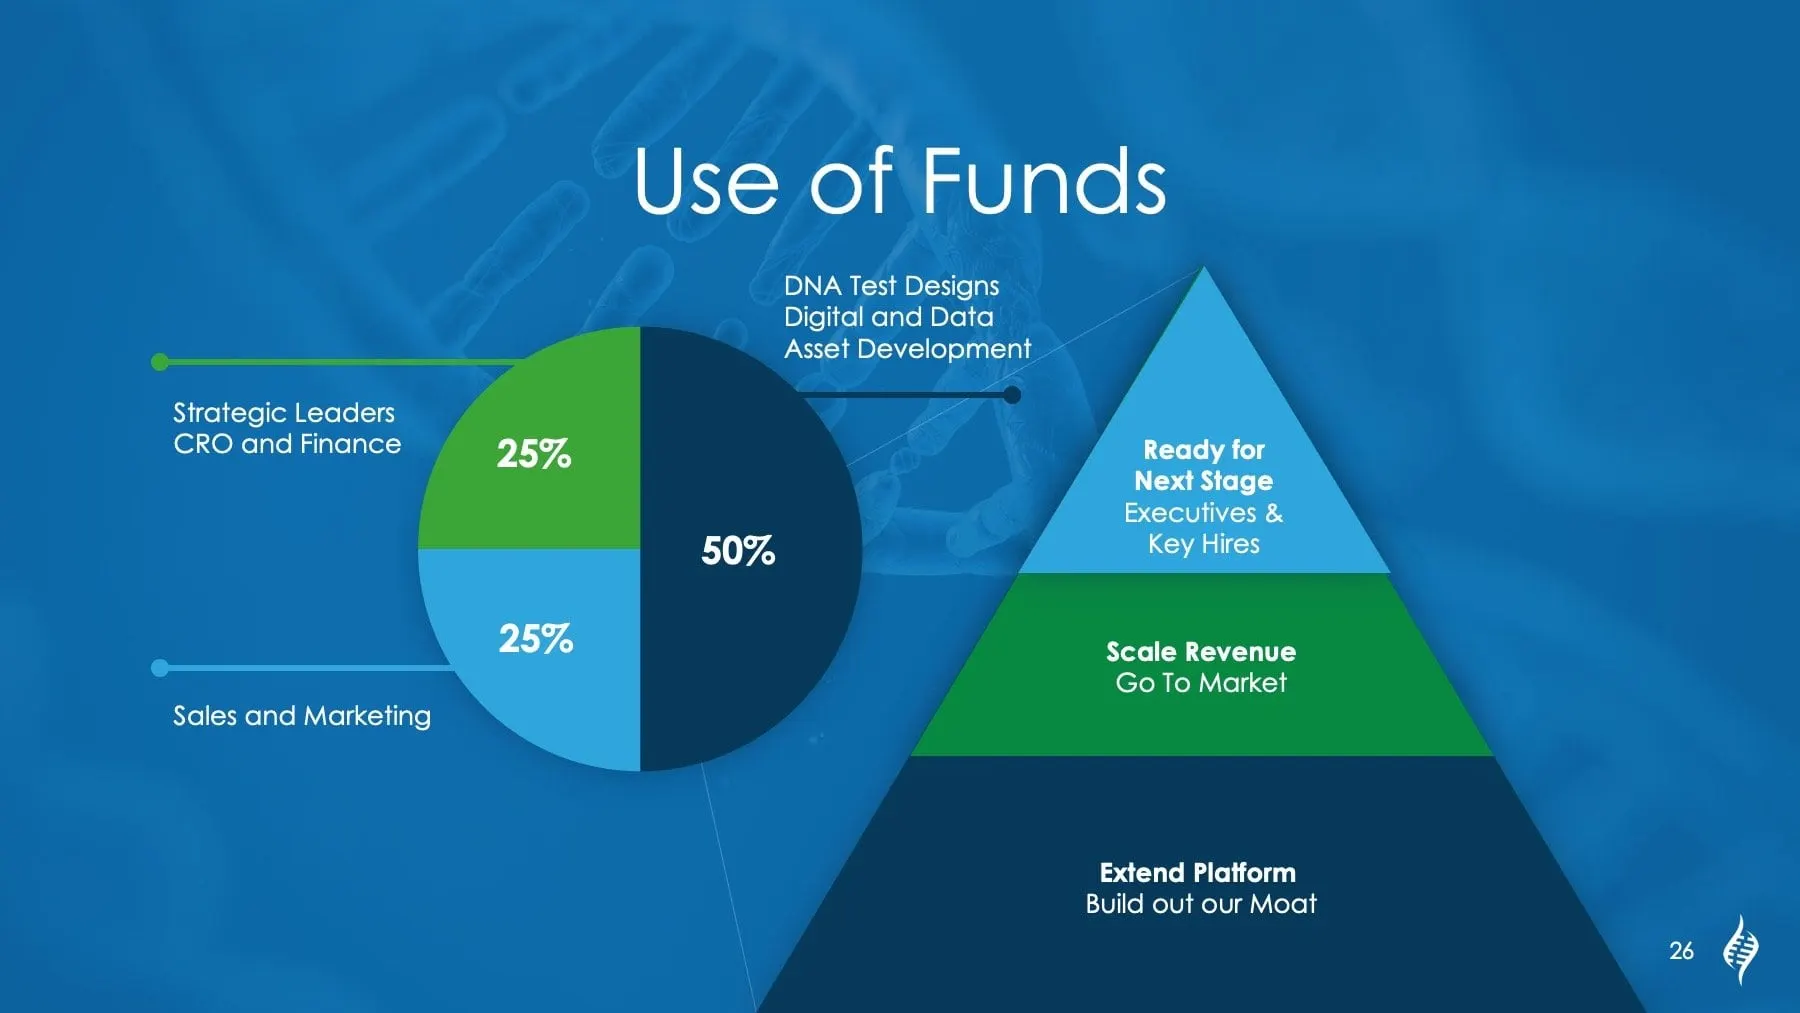
Value Delivery reduces the business model to three icons: survey designs, field test kits and customer success. Use of Funds pairs a pie chart with a three-tier pyramid, so the split of investment and the sequence of growth can be read in seconds.
05 — The result
A deck PBI can keep presenting
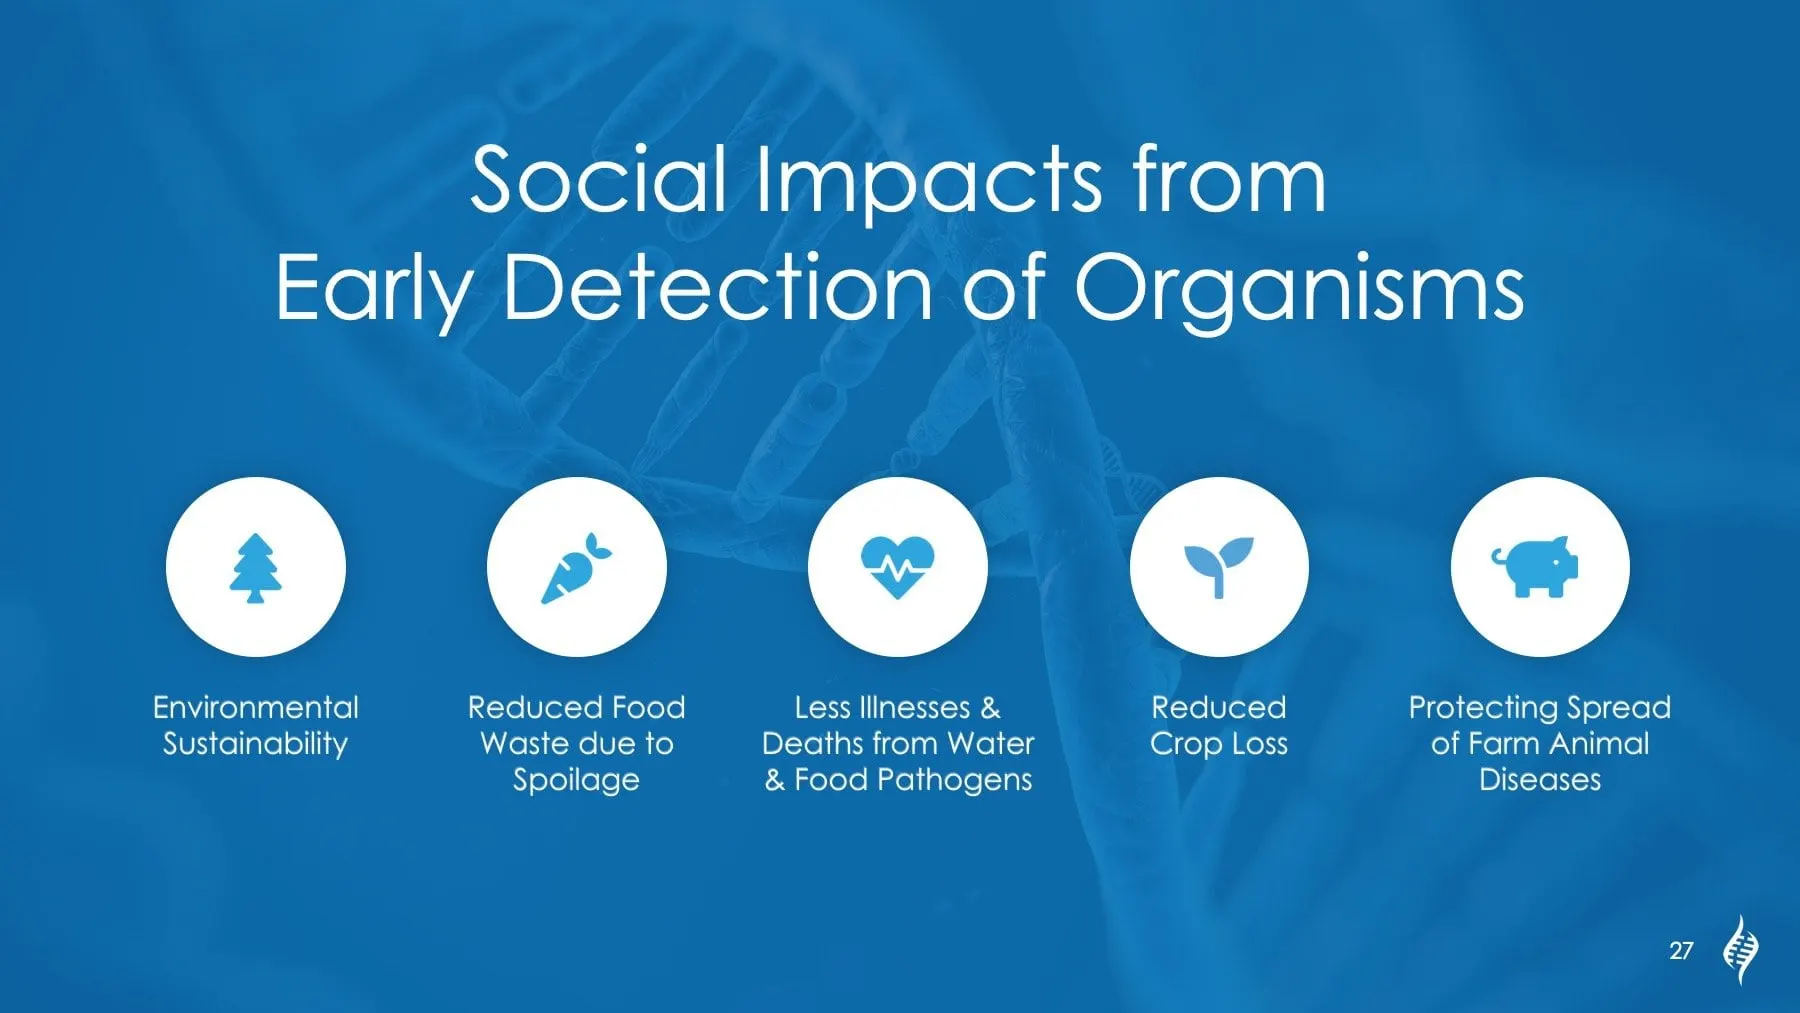
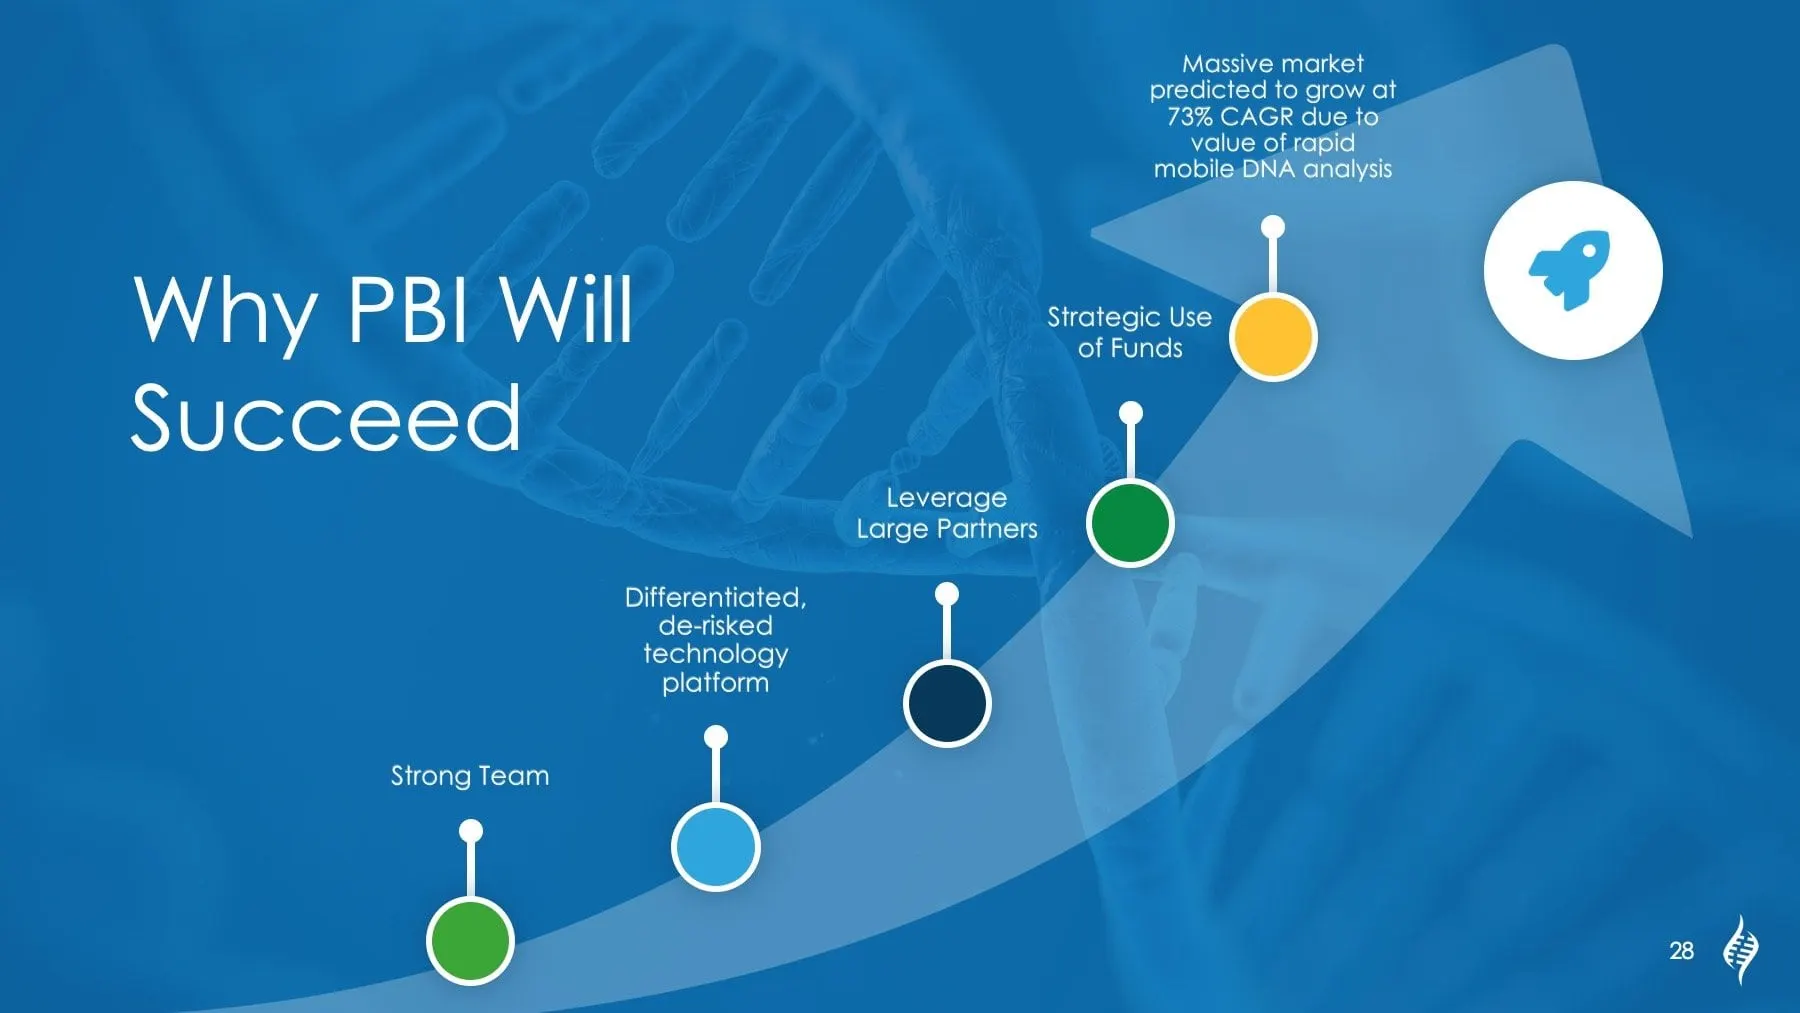
The deck closes the way it opens — with impact. Social Impacts from Early Detection of Organisms lists five outcomes, from reduced food waste to fewer illnesses from water and food pathogens. Why PBI Will Succeed lays the argument along a rising arrow: strong team, differentiated technology, large partners, strategic use of funds and a growing market.
Because everything was built as a native PowerPoint with consistent masters, icon styles and colour rules, PBI's team can update figures, reorder sections and add new test categories without breaking the design. A science-heavy story now reads as a clear sequence: problem, platform, plan, impact.
If you are preparing a raise, our work for AgFuse and the BioGas deck shows the same approach applied to other emerging companies. We work with startups and emerging brands across Canada and the US.
What we delivered
A fully editable investor presentation for Precision Biomonitoring.